Figures & data
Figure 1 Characteristics of Cu-CDs. (A) TEM image of Cu-CDs. The Inset indicates the lattice structure of Cu-CDs. (B) XPS survey spectrum of Cu-CDs. (C) XPS high-resolution survey of Cu 2P. (D) FTIR spectrum of Cu-CDs.
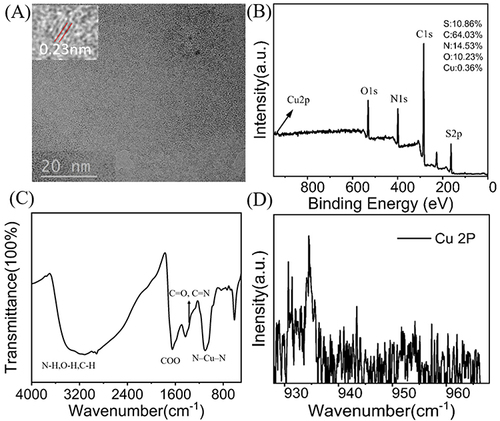
Figure 2 Spectral properties of Cu-CDs. (A) UV–vis absorption of Cu-CDs. (B) PLE (black line) and PL (red line) spectra of Cu-CDs.
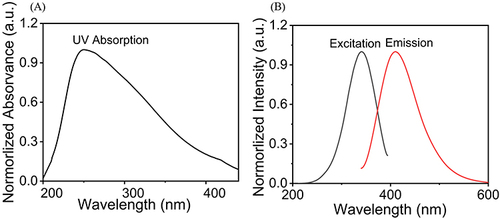
Figure 3 In vivo biocompatibility assessment of Cu-CDs. (A) Liver index. (B) Renal index. (C) Testis index. (D) BUN level. (E) CRE level. (F) AST level. (G) ALT level. (H) IL-1β level. (I) IL-10 level. (J) HE staining. ns represents P>0.05.
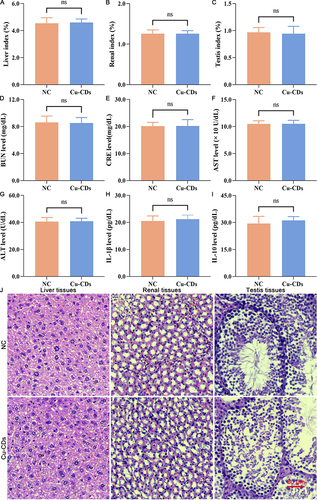
Figure 4 In vitro biocompatibility assessment of Cu-CDs. (A) Representative morphology of Cu-CDs exposed MacT cells. (B) Representative morphology of Cu-CDs exposed TM3 cells. (C) Representative morphology of Cu-CDs exposed NRK52E cells. (D) Viability of MacT cells treated with Cu-CDs after 24 h. (E) Viability of TM3 cells treated with Cu-CDs after 24 h. (F) Viability of NRK52E cells treated with Cu-CDs after 24 h. ns represents P>0.05.
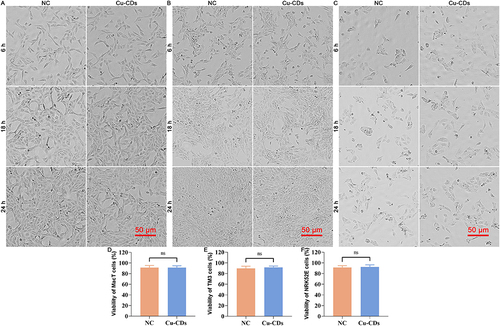
Figure 5 Effect of Cu-CDs treatments on the viability, proliferation, migration, invasion, adhesion, clonogenicity, cell cycle distribution, and apoptosis of MDA-MB-231 cells. (A) Representative EdU staining. (B) Relative EdU staining intensity. (C) Representative result of cell migration. (D) Quantitative result of cell migration. (E) Representative result of cell invasion. (F) Quantitative result of cell invasion assay. (G) Representative result of cell adhesion. (H) Quantitative result of cell adhesion assay. (I) Representative result of colony formation assay. (J) Quantitative result of colony formation assay. (K) Cell cycle distribution by flow cytometry. (L) Percentage of cells in each cell cycle phase. (M) Representative IF staining of γH2A. (N) Relative staining intensity of γH2A. (O) Representative FACS result of Annexin V/PI staining. (P) Apoptosis rate. *Represents P<0.05, with **Representing P<0.01, and ***Representing P<0.001.
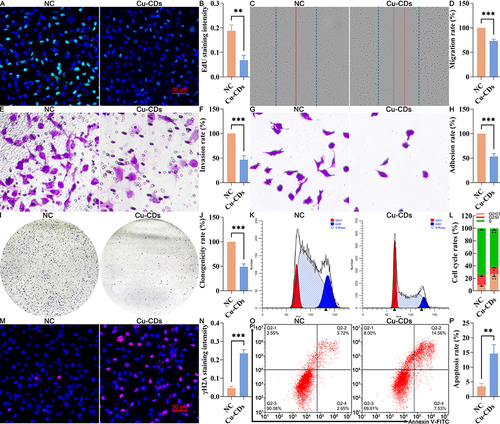
Figure 6 Effect of Cu-CDs treatments on the redox imbalance of MDA-MB-231 cells. (A) Representative MitoTracker staining. (B) Relative MitoTracker staining intensity. (C) Representative JC-1 staining. (D) Relative staining ratio of J-AGG/J-MON. (E) Representative DCFH-DA staining. (F) Relative DCFH-DA staining intensity. (G) SOD activity. (H) GSH activity. (I) MDA activity. *Represents P<0.05, with **Representing P<0.01, and ***Representing P<0.001.
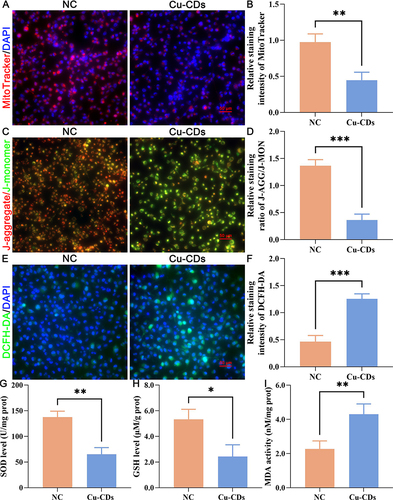
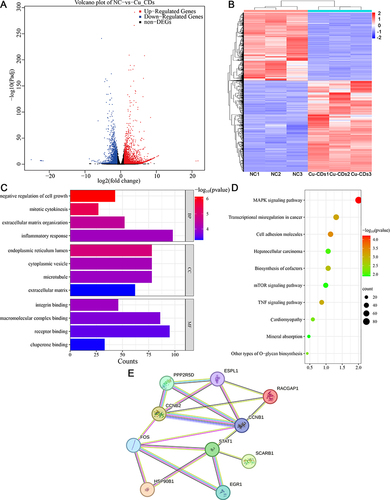
Figure 7 Effect of Cu-CDs treatments on the transcriptome characteristics of MDA-MB-231 cells. (A) Volcano plots of DEGs. (B) Heat map of DEGs. (C) GO analysis. (D) KEGG pathway enrichment analysis. (E) Protein–protein interaction network analysis of hub genes.