Figures & data
Figure 1 (A) Criteria of light-triggered solute release from 1,2-bis (tricosa-10,12-diynoyl)-sn-glycero-3-phosphocholine (DC8,9PC) liposome formulations. Light sensitivity of liposomes containing the DC8,9PC (red) with either dipalmitoylphosphatidylcholine (DPPC; purple) or 1-palmitoyl-2-oleoyl phosphatidylcholine (POPC; green) are shown. DC8,9PC is clustered in DPPC matrix but relatively homogeneously dispersed in POPC (as shown). Entrapped molecules are either calcein green (Cal-G) or calcein blue (Cal-B). The formulations containing DPPC as the matrix lipid are sensitive to light treatments resulting in release of entrapped solutes (shown by √). Formulations containing POPC are not sensitive to light treatments and hence do not release entrapped solutes (indicated by X). Treatments with 254 nm (ultraviolet [UV]) promote solute release independent of the properties of entrapped solute. Treatments with 514 nm laser, however, require Cal-G as the entrapped solute. (B) The lipids used in this study.
Abbreviation: DSPE-PEG2000, 1,2-distearoyl-sn-glycero-3 phosphoethanolamine-N-(methoxy[PEG]-2000 [ammonium salt]).
![Figure 1 (A) Criteria of light-triggered solute release from 1,2-bis (tricosa-10,12-diynoyl)-sn-glycero-3-phosphocholine (DC8,9PC) liposome formulations. Light sensitivity of liposomes containing the DC8,9PC (red) with either dipalmitoylphosphatidylcholine (DPPC; purple) or 1-palmitoyl-2-oleoyl phosphatidylcholine (POPC; green) are shown. DC8,9PC is clustered in DPPC matrix but relatively homogeneously dispersed in POPC (as shown). Entrapped molecules are either calcein green (Cal-G) or calcein blue (Cal-B). The formulations containing DPPC as the matrix lipid are sensitive to light treatments resulting in release of entrapped solutes (shown by √). Formulations containing POPC are not sensitive to light treatments and hence do not release entrapped solutes (indicated by X). Treatments with 254 nm (ultraviolet [UV]) promote solute release independent of the properties of entrapped solute. Treatments with 514 nm laser, however, require Cal-G as the entrapped solute. (B) The lipids used in this study.Abbreviation: DSPE-PEG2000, 1,2-distearoyl-sn-glycero-3 phosphoethanolamine-N-(methoxy[PEG]-2000 [ammonium salt]).](/cms/asset/ece5c565-f089-4a1b-a3dc-919e995a76fb/dijn_a_44993_f0001_c.jpg)
Table 1 Liposome formulation reference table
Figure 2 Effect of light treatment on calcein green (Cal-G)-loaded dipalmitoylphosphatidylcholine (DPPC):1,2-bis (tricosa-10,12-diynoyl)-sn-glycero-3-phosphocholine (DC8,9PC) liposomes. Liposomes (100 μL, formulation I, ) were placed in wells of a 96-well plate for polymerization assay. The samples were either treated with 254 nm ultraviolet (UV; 40 minutes) or 514 nm laser (10 minutes) as indicated. Untreated liposomes served as a control. Following treatments, the wells were photographed using a color camera and images are shown as indicated. For Cal-G release, liposomes were treated with either 254 nm UV or 514 nm laser at indicated times. Fluorescence was measured at Ex/Em 490/517 nm and percentage release was calculated (Materials and methods section).
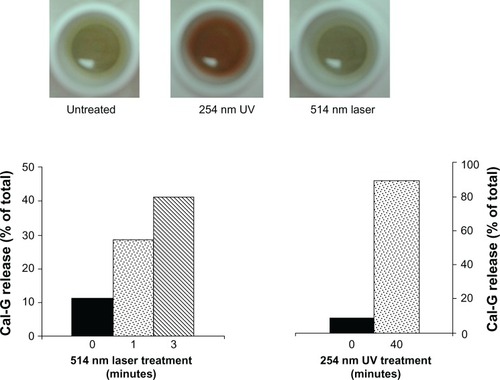
Figure 3 Effect of light treatment on release of inulin from liposomes. Liposomes were prepared either with encapsulated 3H-inulin only (formulation III, ) or coencapsulated with calcein green (Cal-G) and 3H-inulin (formulation IV, ) and treated with either 514 nm laser (10 minutes, B, E and H) or 254 nm (45 minutes, C, F and I). Untreated liposomes were used as controls (A, D and G). Released solutes were separated from liposome-encapsulated solutes by fractionation of the samples on Sepharose CL-6B column collecting 1.0 mL fractions (×30). The fractions were analyzed for radioactivity and fluorescence (Materials and methods section). The values are expressed as percent solute present in each fraction taking the total radioactivity or fluorescence in all 30 fractions as 100%.
Notes: Peak I, liposomal solutes; peak II, free solutes. The data are reproducible from two independent experiments.
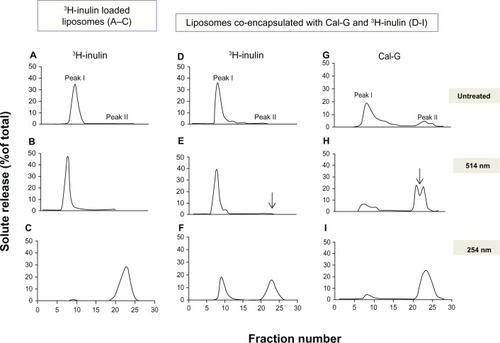
Figure 4 (A) Effect of ascorbic acid (AA) on 514 nm laser-triggered calcein green (Cal-G) release from formulation I. (i): AA inhibits 514 nm laser-triggered Cal-G release from liposomes. AA (0, 0.5, or 1 mM) was added to the Cal-G loaded liposomes (formulation I, ) for 24 hours at room temperature and then exposed to 514 nm laser, and Cal-G release from liposomes was measured (Materials and methods section). The values are expressed as percentage of Cal-G release from liposomes taking triton X (TX)-100 fluorescence as 100% leakage. (ii): AA consumption in 514 nm laser-treated liposomes. AA (0.625 mM) was added to Cal-G (formulation I, squares) or calcein blue (Cal-B; formulation II, triangles). Subsequently, liposomes were treated by 514 nm laser for 0–8 minutes and degradation of AA was detected by absorbance measurement (265 nm). Empty liposomes (without encapsulation of calcein, diamonds) were used as controls. (iii): Effect of free dyes on AA consumption. AA (0.625 mM) was added to Cal-G (diamonds) or Cal-B (squares). After treatment by 514 nm laser for 0–3 minutes, AA degradation was detected by absorbance measurement at 265 nm. (B) Effect of NaN3 on 514 nm laser-triggered calcein release from liposomes. NaN3 was encapsulated within liposomes (formulation I) during sonication at a concentration of 10 mM. The percentage of calcein released in NaN3 coencapsulated and control liposomes before (dotted bar) and after treatment (diagonal bars) with a 514 nm laser (5 minutes) was detected by fluorescence measurement.
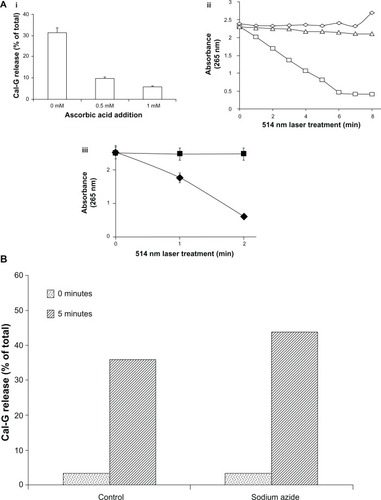
Figure 5 (A) Production of H2O2 in 514 nm laser-treated liposomes. Calcein-loaded liposomes (formulations I and II) were treated by 514 nm laser (5 minutes) and filtered, and H2O2 concentration was measured, as described in the Materials and methods section. Standard deviation values were as follows: calcein green (Cal-G), 0.177 and 0.13 μM before and after laser treatment, respectively; calcein blue (Cal-B), 0.425 and 0.016 μM before and after laser treatment, respectively. (B) Direct addition of H2O2 does not rupture liposomes in the absence of light. H2O2 (0–1 mM) was added directly to Cal-G-loaded liposomes (formulation I), and samples were allowed to incubate at room temperature (25°C) for 0–40 minutes. Cal-G release was measured (Materials and methods section). Fluorescence was then measured to determine if liposomes had released calcein. Triton X-100 (10 μL) was then added to each sample, and fluorescence was measured again to serve as a comparison of total release. Solid-gray bars, time zero; diagonal bars, liposomes incubated for 40 minutes. Standard deviation values at various concentrations of H2O2 were as follows: time zero, 0.35 (0 mM), 0.005 (0.25 mM), 0.026 (0.5 mM), and 0.098 (1 mM); 40-minute incubations, 0.18 (0 mM), 0.055 (0.25 mM), 0.054 (0.5 mM), and 0.031 (1 mM).
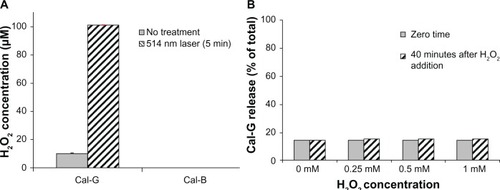
Figure 6 (A and B) Effect of potassium ferricyanide on calcein green (Cal-G) release from liposomes. Liposomes were prepared using the lipid composition dipalmitoylphosphatidylcholine (DPPC):1,2-bis (tricosa-10,12-diynoyl)-sn-glycero-3-phosphocholine (DC8,9PC): distearoylphosphatidylethanolamine (DSPE)-polyethylene glycol (PEG)-2000 (88:10:02 mol%) and were loaded with Cal-G alone or Cal-G and K3Fe(CN)6 (see Materials and methods section for details). Liposomes were treated with 514 nm laser for 0–3 minutes, and Cal-G release was monitored (expressed as percentage of total, A). Solid grey, 0-minute; diagonal bars, 1-minute; solid black bars 3-minute laser treatments. Fluorescence of free Cal-G was also tested in the presence of various concentrations of K3Fe(CN)6 (B).
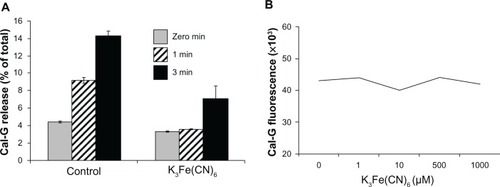
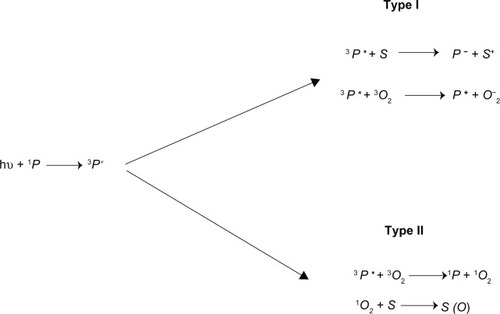
Figure 7 Schematic presentation of the photoactivation reactions.