Figures & data

Figure 1 Isolation and identification of hucMSCs. (A) Brief procedure for isolating and cultivating primary hucMSCs. (B) Flow cytometry identification of primary hucMSCs. (C) Cell morphology of primary hucMSCs. After passaging, cell membranes and nuclei were stained with CM-Dil (Dil) and Hoechst 33342, and observed under a fluorescence microscope after 24 and 48 h. Scale bar: 400 µm.
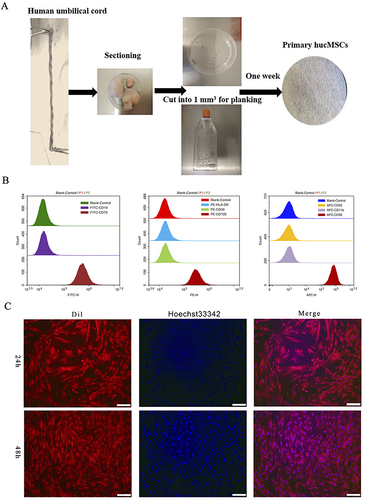
Figure 2 Modification of hucMSCs. (A) Infection efficiency of negative lentivirus (negative control) and BMP7 gene overexpression lentivirus (BMP7+) in hucMSCs. (B) Expression efficiency of negative lentivirus (negative control) and BMP7 gene overexpression lentivirus (BMP7+) in hucMSCs. BMP7+(H) scale bar: 100 µm. Other scale bars: 200 µm. (C) RT-qPCR results of BMP7 mRNA expression in blank control, negative control, and BMP7+ in hucMSCs. The following primers were used: forward: 5ʹ-TTCGTCAACCTCGTGGAACAT-3ʹ, reverse: 5ʹ-GAAGCGTTCCCGGATGTAGT-3ʹ. (D) Western blotting result of relative BMP7 protein expression qualification in hucMSCs. (E) Western blotting quantification. ns P > 0.05, ***P < 0.001, ****P < 0.0001.
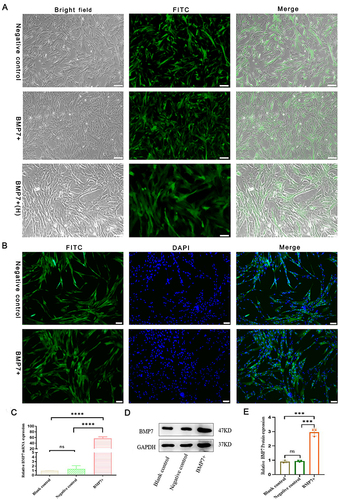
Figure 3 Isolation and identification of BMP7+sEVs. (A) Process of ultracentrifugation for hucMSC-sEVs purification. (B) TEM images of blank-sEVs, negative-sEVs, and BMP7+sEVs. (C) Size distribution of blank-sEVs, negative-sEVs, and BMP7+sEVs based on NTA. (D) Flow cytometry analysis of blank-sEVs, negative-sEVs, and BMP7+sEVs for CD9 and CD63. (E) Western blotting analysis of BMP7+hucMSCs cell and sEV for BMP7 and GAPDH. (F) Western blotting quantification. **P < 0.01.
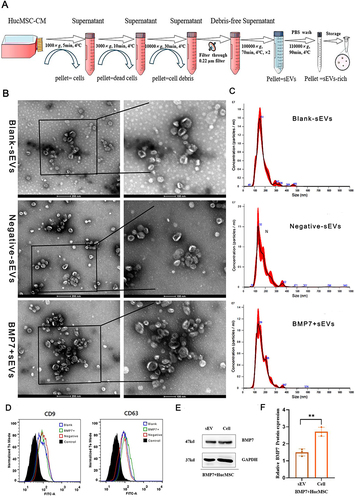
Figure 4 BMP7+sEVs in vivo biodistribution and ex vivo organ distribution. (A) In vivo biodistribution images of DiR (dissolved in PBS), blank-sEVs, and BMP7+sEVs in normal c57BL/6J mice. (B) In vivo biodistribution of blank-sEVs, negative-sEVs, and BMP7+sEVs in liver fibrosis C57BL/6J mice. (C) Major organs from healthy mice after intravenous injection with hucMSC-sEVs. (D) Fluorescence imaging of key organs in liver fibrosis mouse models 96 h following intravenous injection with DiR-labeled blank-sEVs, negative-sEVs, and BMP7+sEVs. (E) Immunofluorescence of α-SMA and sEVs in the liver tissues of C57BL/6J mice. Scale bars: 500 and 50 µm. (F) Co-quantification of hucMSC-sEVs and α-SMA fluorescence.
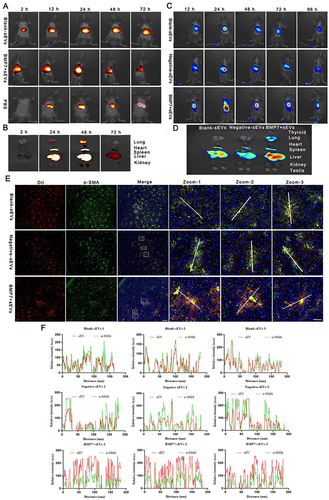
Figure 5 Therapeutic efficacy of BMP7+sEVs in liver fibrosis mice. (A) Treatment regimen using hucMSC-sEVs for liver fibrosis. i.p: intraperitoneal injection, i.v: tail vein injection. (B) HE staining, Masson staining, IHC, and immunofluorescence of α-SMA from liver tissues of normal control (NC) as well as PBS-, blank-sEVs-, negative-sEVs-, and BMP7+sEVs-treated mice. Scare bar: 100 µm. (C) Quantification of the fibrotic area using Masson staining. The bar graph depicts the quantification of α-SMA staining. ns P > 0.05, ***P < 0.001, ****P < 0.0001.
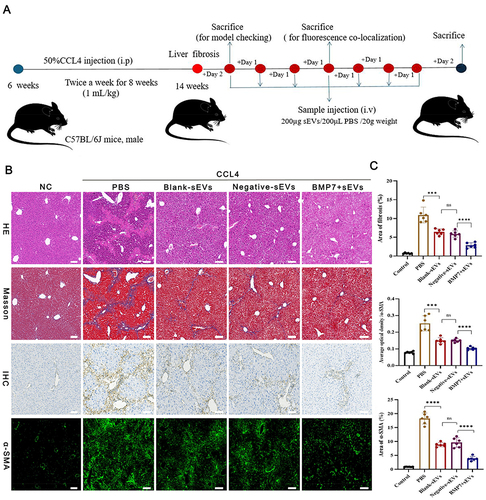
Figure 6 BMP7+ sEVs improved live injury and attenuated liver fibrosis. (A) IHC of α-SMA and COL1A1 from liver tissues in normal control (NC) as well as PBS-, blank-sEVs-, negative-sEVs-, and BMP7+sEVs-treated mice. Scare bar: 100 µm. (B) The bar graph depicts the quantification of α-SMA and COL1A1 staining. (C) The expression level of α-SMA and COL1A1in liver tissue suspension. (D) The level of serum ALT and AST. (E) The level of serum HA, IV-C, and PC-III. ns P > 0.05, *P < 0.05, **P < 0.01, ***P < 0.001, ****P < 0.0001.
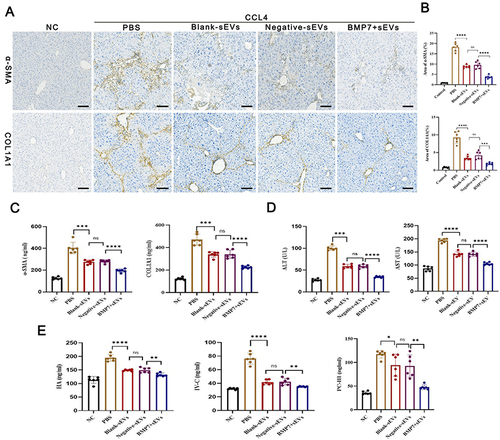
Figure 7 Effect of BMP7+sEVs on aHSCs. (A) Co-localization of Dil-labeled blank-sEVs, negative-sEVs, and BMP7+sEVs (red), and cell nuclei stained with DAPI (blue) after sEVs treatment of aHSCs for 12 h. Scale bars: 50 µm. (B) Visualization of LDs using TEM and Oil Red O staining in control (negative control), blank-sEVs, negative-sEVs, and BMP7+sEVs after sEV treatment of aHSCs for 48 h. The three types of colored arrows in the TEM indicate the different types of LDs (blue: cholesterol LDs, red: triglycerides LDs, pink: mixed LDs). TEM scale bars: 5.0 µm, Oil Red O staining scale bars: 6 µm.
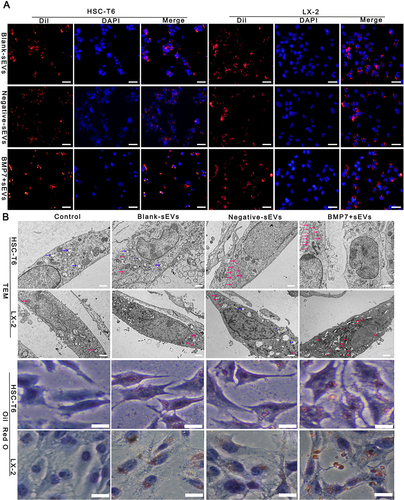
Figure 8 Anti-fibrosis effect of BMP7+sEVs in vitro. (A) Effect of hucMSC-sEVs on HSC-T6 and LX-2 cell migration abilities. Scale bars: 50 µm. (B) Bar graph shows the analysis results of the selected fields. (C) Immunofluorescence of α-SMA (red) in control (negative control), blank-sEVs-, negative-sEVs-, and BMP7+sEVs-treated aHSCs for 48 h. DAPI-stained nuclei (blue). Scale bars: 20 µm. (D) The bar graph shows the analysis results of the selected fields. ns P > 0.05, ***P < 0.001, ****P < 0.0001.
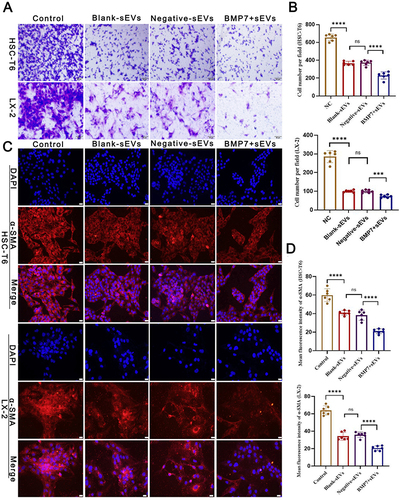
Figure 9 Effect of BMP7+sEVs on aHSC proliferation. (A) Cell count in the control (negative control), blank-sEVs, negative-sEVs, and BMP7+sEVs groups after sEV treatment of aHSCs for 0, 48, and 120 h. Scale bars: 1000 µm. (B) Line chart shows the growth curve in each group.
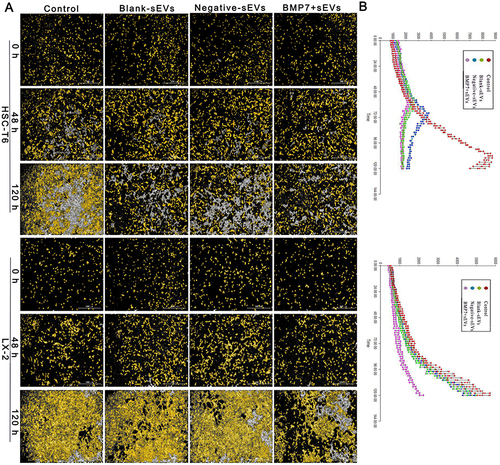
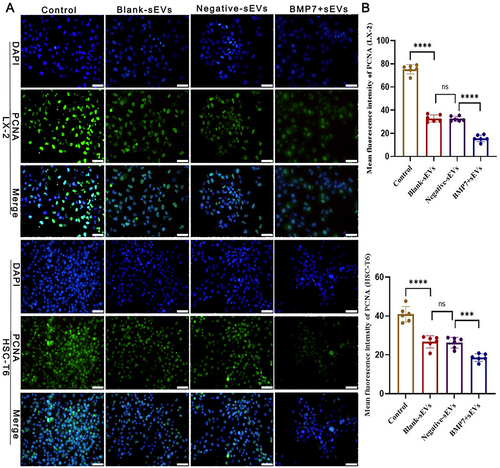
Figure 10 Effect of BMP7+sEVs on aHSC proliferation. (A) Proliferating cell nuclear antigen immunofluorescence (green) in control, blank-sEVs, negative-sEVs, and BMP7+sEVs after sEV treatment of aHSCs for 48 h. DAPI-stained nuclei (blue). Scale bars: 50 µm. (B) Bar graph shows the analysis results of the selected fields. ns P > 0.05, ***P < 0.001, ****P < 0.0001.