Figures & data
Table 1 Actual values of independent variables
Table 2 Formulations of nanostructured lipid carriers loaded with both oleanolic acid and gentiopicrin by central composite design
Figure 1 Particle size and zeta potential of various surfactants.
Abbreviations: PS, particle size; ZP, zeta potential; PVP, polyvinylpyrrolidone.
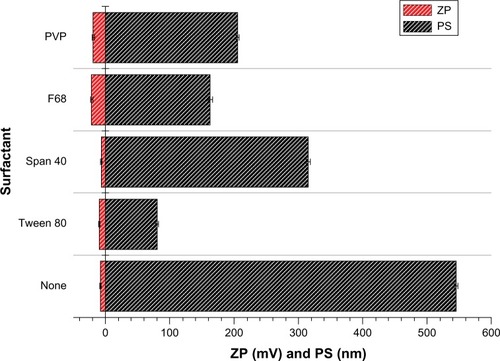
Figure 2 Entrapment efficiency of samples prepared at different concentrations of Poloxamer 188.
Abbreviations: EE, entrapment efficiency; GEN, gentiopicrin; OA, oleanolic acid.
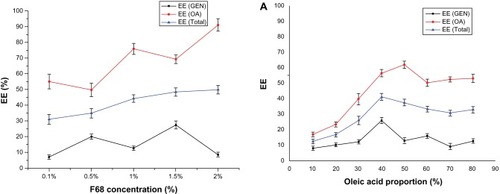
Figure 3 Effect of proportion of oleic acid on drug entrapment efficiency (A) and particle size (B).
Abbreviations: EE, entrapment efficiency; GEN, gentiopicrin; OA, oleanolic acid.
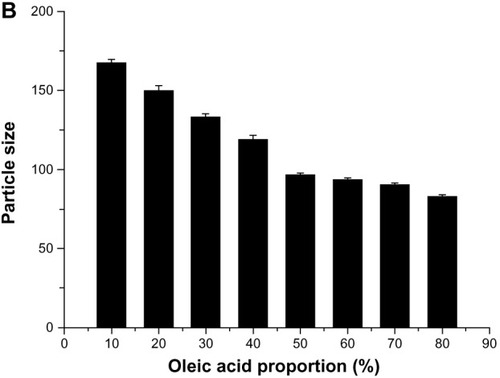
Table 3 Analysis of variance results for oleanolic acid, gentiopicrin and total entrapment efficiency, shown as R1, R2, and R3, respectively
Figure 4 Three-dimensional map of R1 (A) and R3 (B) follows interaction between independent variables (AB).
Abbreviations: EE, entrapment efficiency; GEN, gentiopicrin; OA, oleanolic acid.
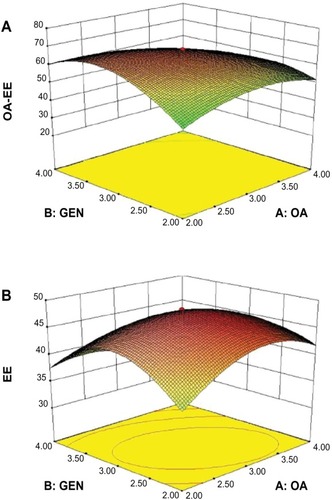
Figure 5 Particle size distribution (A) and zeta potential distribution (B) of GO-NLCs.
Abbreviation: GO-NLCs, nanostructured lipid carriers loaded with both oleanolic acid and gentiopicrin.
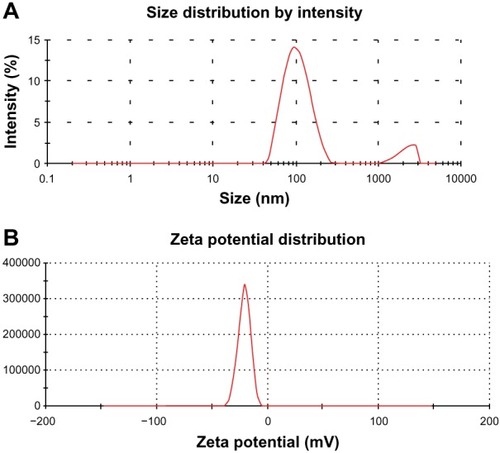
Figure 6 Transmission electron microscopy of optimized nanostructured lipid carriers loaded with both oleanolic acid and gentiopicrin showing spherical morphology (×87,000).
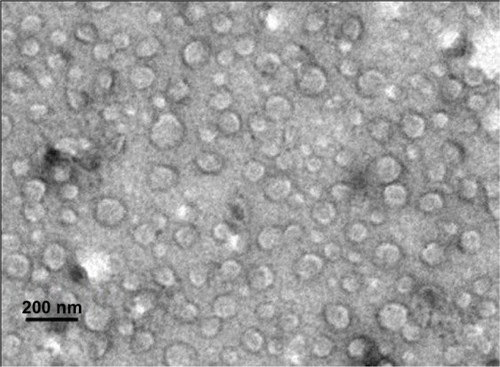
Figure 7 Differential scanning calorimetry curve of GMS, GEN, OA, and freeze-dried GO-NLCs.
Abbreviations: GMS, glycerin monostearate; GEN, gentiopicrin; OA, oleanolic acid; GO-NLCs, nanostructured lipid carriers loaded with both oleanolic acid and gentiopicrin.
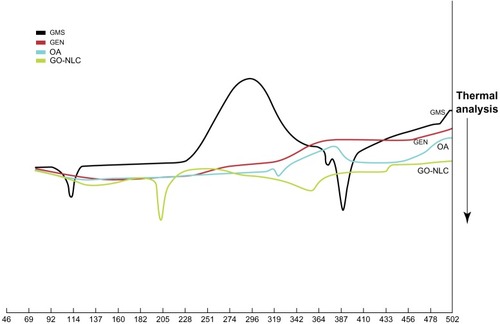
Table 4 Models for drug-release fitting and correlation coefficients of nanostructured lipid carriers loaded with both oleanolic acid and gentiopicrin
Figure 8 In vitro release curves for GEN, OA, and GO-NLCs.
Abbreviations: GEN, gentiopicrin; OA, oleanolic acid; GO-NLCs, nanostructured lipid carriers loaded with both oleanolic acid and gentiopicrin.
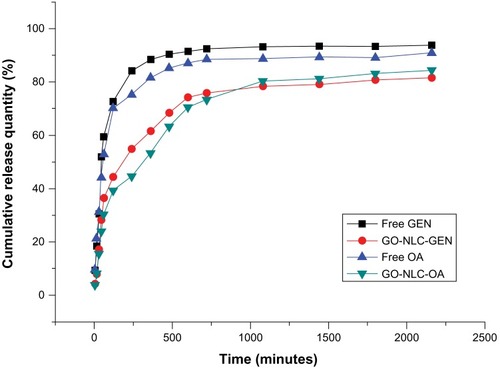
Table 5 Plasma pharmacokinetic parameters for gentiopicrin and oleanolic acid after intravenous administration of gentiopicrin, oleanolic acid, and GO-NLCs
Figure 9 Plasma concentration-time curves for gentiopicrin and oleanolic acid after intravenous administration of gentiopicrin + normal saline, oleanolic acid + normal saline, and nanostructured lipid carriers loaded with both oleanolic acid and gentiopicrin.
Abbreviations: GEN, gentiopicrin; OA, oleanolic acid; GO-NLCs, nanostructured lipid carriers loaded with both oleanolic acid and gentiopicrin.
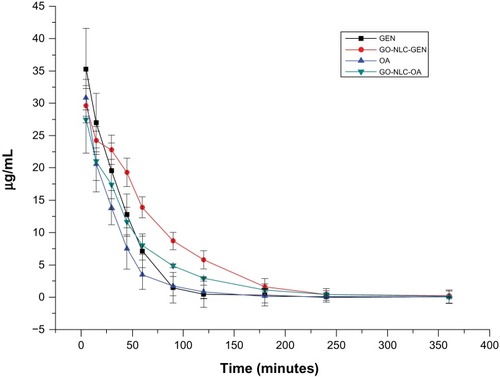
Figure 10 Aspartate and alanine aminotransferase levels in rats suffering acute hepatic damage in response to administration of carbon tetrachloride.
Abbreviations: GEN, gentiopicrin; OA, oleanolic acid; GO-NLCs, nanostructured lipid carriers loaded with both oleanolic acid and gentiopicrin; AST, aspartate aminotransferase; ALT, alanine aminotransferase.
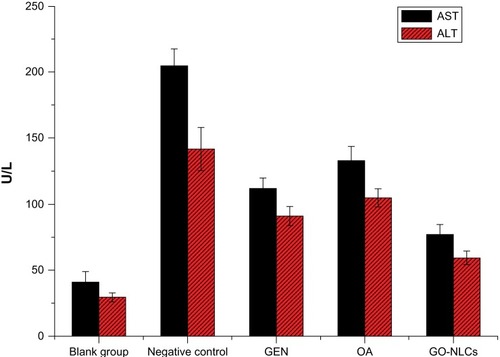
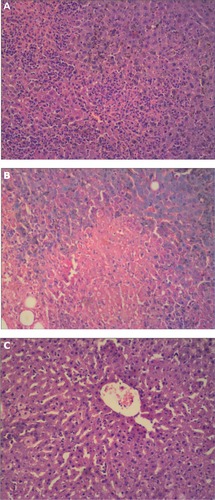
Figure 11 Pathological observation of acute hepatic damage caused by carbon tetrachloride in the rat. (A) Control group, (B) carbon tetrachloride group, and (C) and group treated with nanostructured lipid carriers loaded with both oleanolic acid and gentiopicrin.