
Figures & data
Figure 1 Schematic of numerical model.

Table 1 Thermal and Optical Properties of Skin Layers and SCCCitation31–35
Table 2 Parameters of Numerical Analysis
Figure 2 Diffusion validation result.Citation21
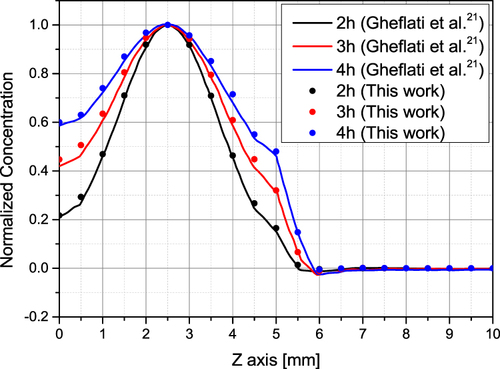
Figure 3 Temperature validation result.Citation21
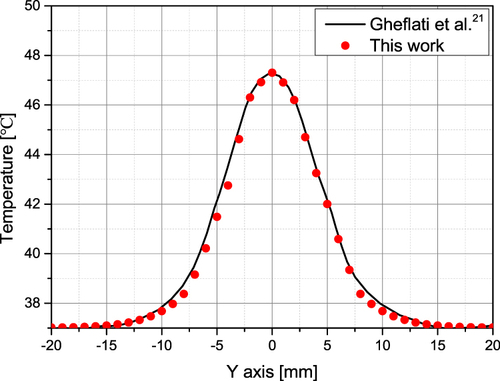
Figure 4 Radial Concentration Distribution (center position, depth = 1 mm). (a) τh = 2 h; (b) Injection dose = 200 μg/mL; (c) Injection dose = 200 μg/mL (1 m < τh < 30 m).
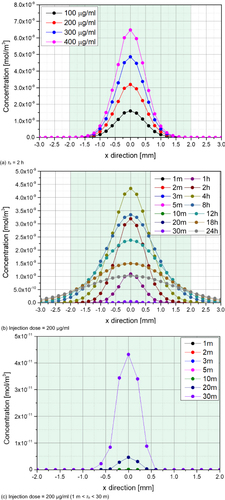
Figure 5 Temperature variation with laser irradiation time (center position, depth = 1 mm, Pl = 0.2 W). (a) τh = 2 h; (b) Injection dose = 200 μg/mL.
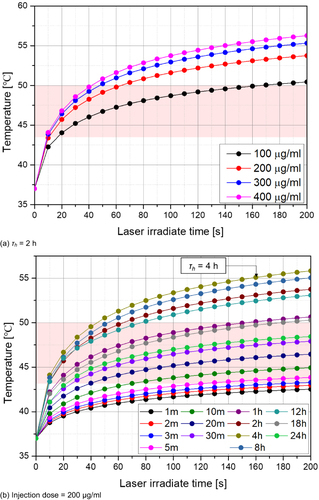
Figure 6 Continued.
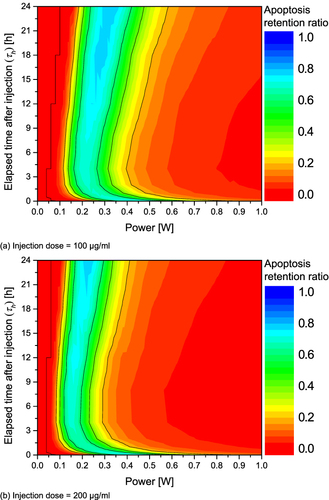
Figure 6 Apoptosis retention ratio(θ*A) for various Pl and τh. (a) Injection dose = 100 μg/mL; (b) Injection dose = 200 μg/mL; (c) Injection dose = 300 μg/mL; (d) Injection dose = 400 μg/mL.
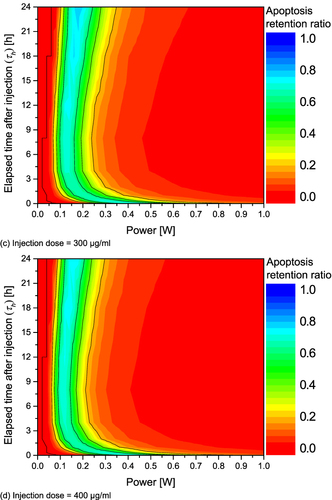
Figure 7 Continued.
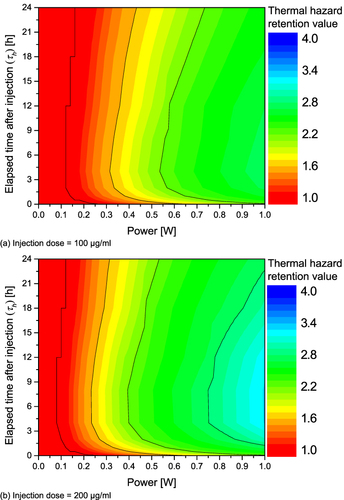
Figure 7 Thermal hazard retention value (θ*H) for various Pl and τh. (a) Injection dose = 100 μg/mL; (b) Injection dose = 200 μg/mL; (c) Injection dose = 300 μg/mL; (d) Injection dose = 400 μg/mL.
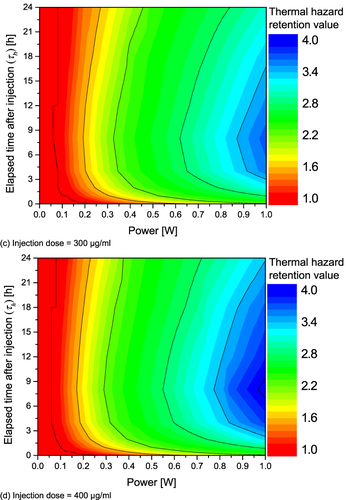
Figure 8 Continued.
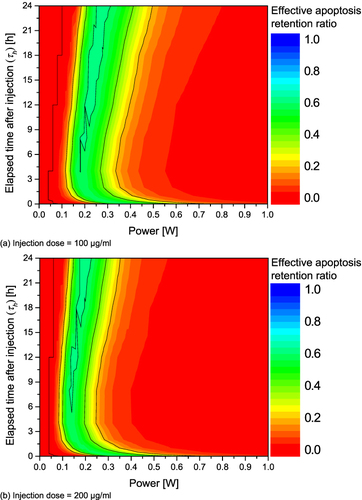
Figure 8 Effective apoptosis retention ratio (θ*eff) for various Pl and τh. (a) Injection dose = 100 μg/mL; (b) Injection dose = 200 μg/mL; (c) Injection dose = 300 μg/mL; (d) Injection dose = 400 μg/mL.
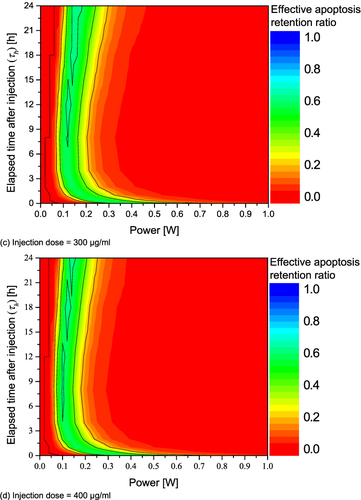
Figure 9 Optimal value of θ*eff and Pl for various injection dose. (a) Maximum effective apoptosis retention ratio; (b) Optimal power.
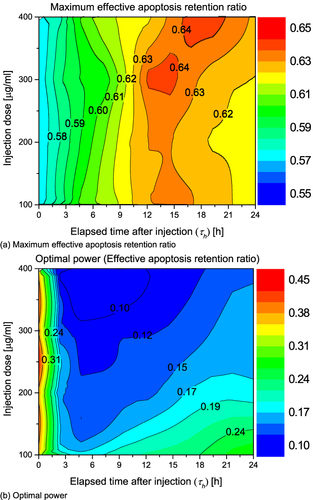
Table 3 Optimal Conditions for Various Injection Dose