Figures & data
Scheme 1 Schematic representation of self-assembly of TPL/Ce6 NPs and dual-synergistic combination therapy of chemotherapy and PDT.
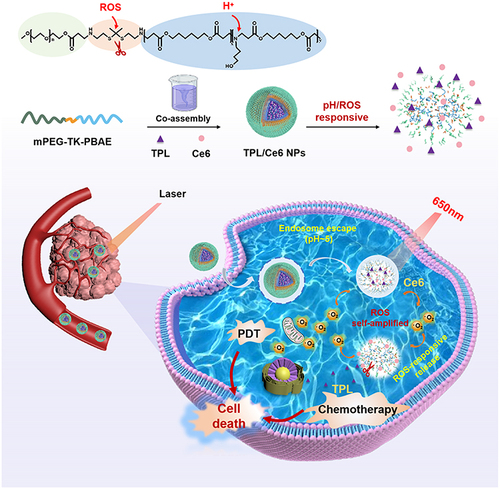
Figure 1 (A) Synthetic route and 1H-NMR spectra (B) of mPEG-TK-PBAE copolymer (the red letters in represent different hydrocarbons, and the red letters in correspond to the hydrogen nuclear mass spectra of the hydrocarbons in ). (C) Schematic diagram of the self-assembly preparation of TPL/Ce6 NPs and pH/ROS dual-responsive drug release property. (D) Particle size distribution determined using DLS and TEM images of TPL/Ce6 NPs. (E) Particle size changes in TPL/Ce6 NPs in response to acid and/or oxidant release media. pH/ROS-responsive drug release (F) and singlet oxygen production efficiency by SOSG probe determination (G) of TPL/Ce6 NPs.
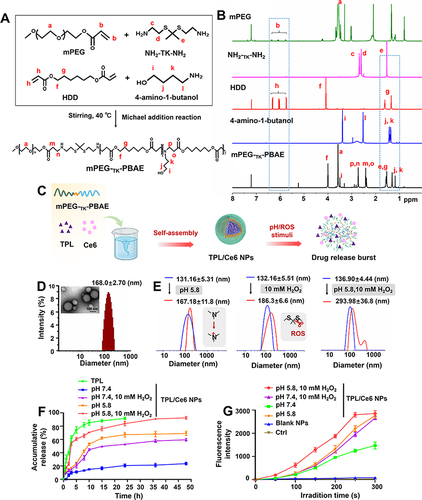
Figure 2 Cellular uptake profiles in HepG2 treatment with either free Ce6 or TPL/Ce6 NPs for 4 h. (A) Representative cellular uptake images by CLSM observation. Hoechst 33342 and phalloidin were employed to label cell nucleus and cytoskeleton. The scale bar is 25µm. Intracellular fluorescence intensity by FCM determination (B) and quantitative results (C). ***p < 0.001 indicates TPL/Ce6 NPs versus free Ce6 group.
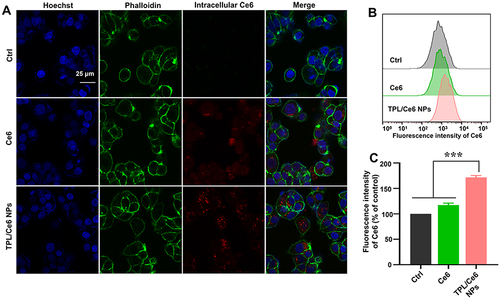
Figure 3 (A) Cytotoxicity of TPL/Ce6 NPs against HepG2 cells with laser irradiation after 48 h treatment. (B) ROS generation in HepG2 cells after various treatments as determined by FCM analysis. (C) Amount of ROS produced. (D–E) Apoptosis rates of HepG2 cells treated with TPL/Ce6 NPs (equivalent to 20 nM TPL and 54 nM Ce6) for 48 h using Annexin V-FITC/PI double staining by FCM analysis. ***p < 0.001 and **p < 0.01 indicates a statistically significant difference between the groups.
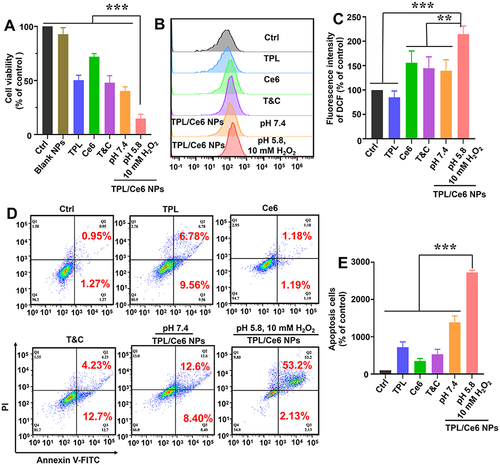
Figure 4 (A) In vivo real-time imaging of H22 tumor-bearing mice after intravenous injection of TPL/Ce6 NPs or free Ce6 at different time intervals, as well as the harvested tumor tissue at 24 h post-injection by ex vivo fluorescent imaging. (B) Experimental design of anti-tumor effects of TPL/Ce6 NPs on H22-bearing tumor mice model. Body weight changes (C) and tumor growth curves (D) of H22 tumor-bearing mice in the whole experiment period. (E) Representative photographs of tumors excised from each group on Day 14. (F) Statistical data of the harvested tumor tissue weight. Doxorubicin (DOX) was employed as the positive control. ***p < 0.001 and *p < 0.05 indicates a statistically significant difference between groups.
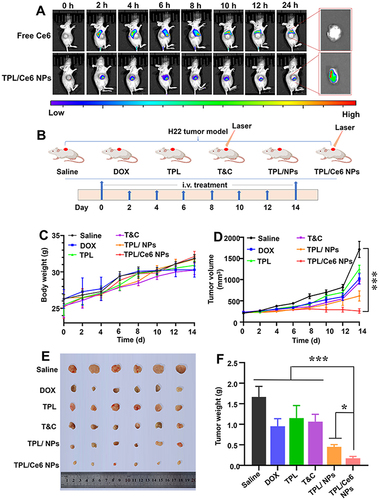
Figure 5 Immunohistochemical (IHC) staining of tumor tissues from H22-bearing tumor mice treated with various formulations. (A) H&E and IHC staining for Ki67 (the brown particles pointed by the red arrow represent positive Ki67 expression), Bax, Bcl-2, CD31 (the brown particles pointed by the red arrow represent positive CD31 expression) and VEGF (brown represents positive expression and blue represents cell nucleus). The scale bar is 50 μm. (B) Semi-quantitative analysis of Ki67, Bax, Bcl-2, VEGF, and CD31 positive expression levels was implemented by ImageJ software. *p < 0.05 indicates a statistically significant difference between the groups.
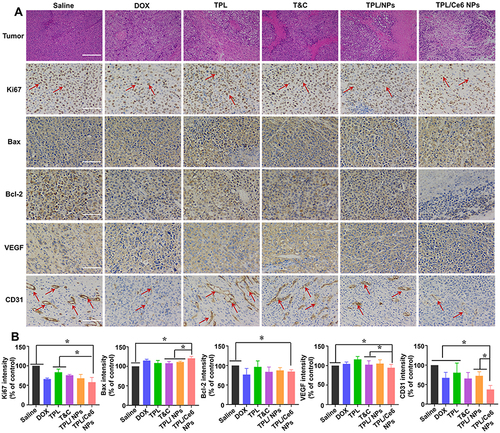
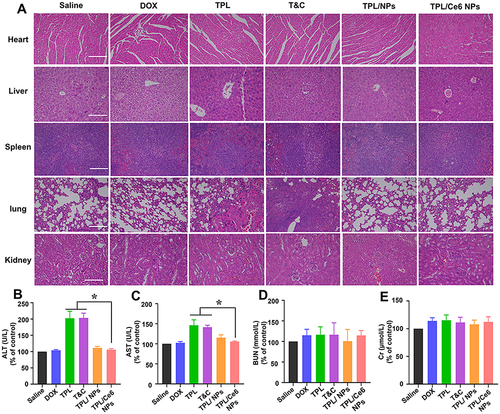
Figure 6 Histological analyses of main organs and blood biochemical indexes derived from H22-bearing tumor mice. (A) H&E histological analyses of main organs after various treatments of the H22 tumor model. The content of ALT (B), AST (C), BUN (D), and Cr (E) in blood after treatment. The scale bar is 50 μm. *p < 0.05 indicates a statistically significant difference between groups.