Figures & data
Figure 1 Exosome biogenesis involves the interaction of these vesicles with target cells. These vesicles originate from the endocytic pathway, arising from the inward budding of the MVB membrane. Reproduced from Xie X, Xiong Y, Panayi AC, et al. Exosomes as a Novel Approach to Reverse Osteoporosis: a Review of the Literature. Front Bioeng Biotechnol. 2020;8:594247. Creative Commons.Citation23
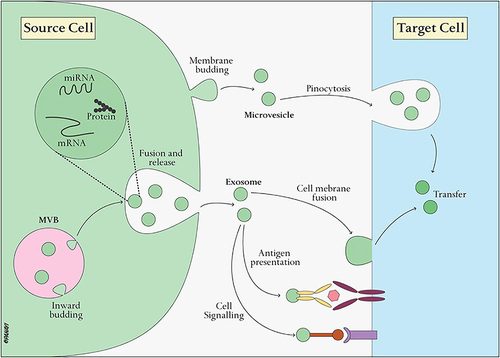
Table 1 Summary of the Methods for Exosome Isolation and Purification
Figure 2 (A) The augmented neurogenesis effect of engineered exosome-encapsulated hydrogel was examined through immunofluorescence staining. The scale bar is set at 50 µm. (B) The schematic representation of the tissue collection timeline. (C) General images depicting wound healing in various treatment groups. (D) Immunofluorescence images illustrating the expression of CGRP, NGF, and CRH in skin tissues on day 7 post-wounding, accompanied by corresponding statistical results. Scale bar: 100 µm. Reproduced from Xiong Y, Lin Z, Bu P, et al. A Whole-Course-Repair System Based on Neurogenesis-Angiogenesis Crosstalk and Macrophage Reprogramming Promotes Diabetic Wound Healing. Adv Mater. 2023;35(19):e2212300. © 2023 The Authors. Advanced Materials published by Wiley-VCH GmbH.Citation58
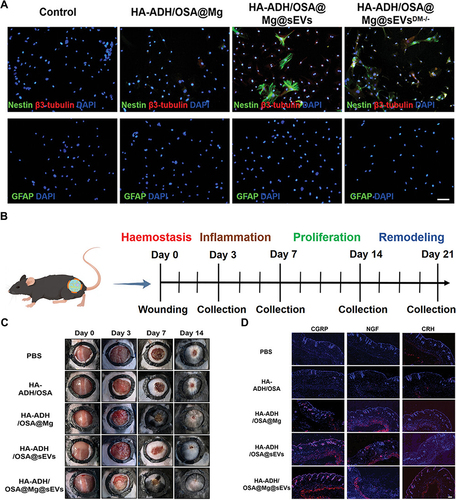
Figure 3 Schematic illustration of preparation of engineered exosome as targeted lncRNA MEG3 delivery vehicles for OS therapy. Reprinted from J Control Release, volume: 343, Huang X, Wu W, Jing D, et al. Engineered exosome as targeted lncRNA MEG3 delivery vehicles for osteosarcoma therapy. 107–11, Copyrihgt 2022, with permission from Elsevier.Citation62
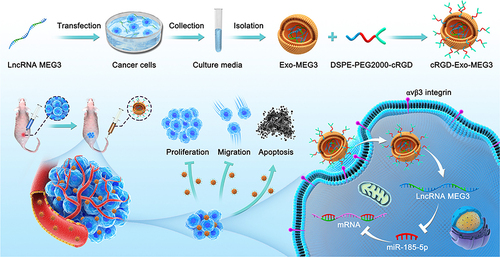
Table 2 Mechanisms of Exosomes in Counteracting Oxidative Stress
Figure 4 (A) Schematic representation of the experimental design for the exosome study in SD rats, with a total of 12 biological independent animals per group. (B) Representative H&E staining images, with the upper panel showing a scale bar of 100 μm and the lower panel showing a scale bar of 50 μm. (C) Representative Gomori’s trichrome staining images, illustrating muscle fibers (red), collagen (blue), nuclei (black-purple), and erythrocytes (red). The scale bar is set at 100 μm for the upper panel and 50 μm for the lower panel. (D) Representative picrosirius red staining images depicting collagen types I and III in red. The scale bar is set at 50 μm. (E) Quantification of fibrosis using the Ashcroft score. Each data point represents information from one animal, with a total of 12 biological independent animals. The Ashcroft score was determined by averaging the scores provided by one blinded and one non-blinded scorer. (F) Quantification of pulmonary hydroxyproline levels. Each data point represents information from one animal, with a total of 4 biological independent animals. Statistical significance is denoted by P < 0.05. Reproduced from Dinh PC, Paudel D, Brochu H, et al. Inhalation of lung spheroid cell secretome and exosomes promotes lung repair in pulmonary fibrosis. Nat Commun. 2020;11(1):1064. Creative Commons.Citation113
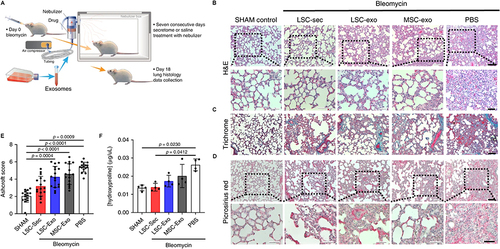
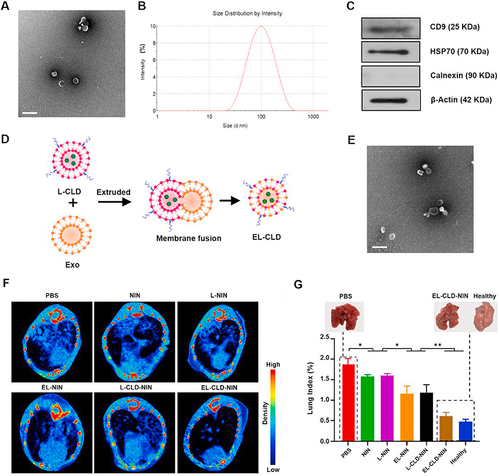
Figure 5 (A) Transmission electron microscopy (TEM) image capturing the morphology of the exosome. (B) Determination of the size and size distribution of L-929 cell-derived exosomes using dynamic light scattering (DLS). (C) Western blot analysis depicting the protein levels of CD9, HSP70, calnexin, and β-actin in the exosomes secreted by L-929 cells. (D) Schematic representation of the procedure employed to produce the EL-CLD hybrid, involving the hybridization of exosomes with L-CLD using membrane extrusion. (E) TEM image illustrating the morphology of the EL-CLD hybrid, showing the successful integration of exosomes with clodronate-loaded liposomes through the described procedure. (F) Micro-CT images depicting the condition of the lung following the respective treatments. (G) Lung Index quantifying pulmonary fibrosis in mice post-treatments, with an inset providing visual comparisons between healthy lungs and those affected by fibrosis at the conclusion of the treatments. The study includes a sample size of n=5. *p<0.05, **p<0.01. Bar: 200 nm. Reproduced from Biomaterials, volume 271, Sun L, Fan M, Huang D, et al. Clodronate-loaded liposomal and fibroblast-derived exosomal hybrid system for enhanced drug delivery to pulmonary fibrosis. 120761, Copyright 2021, with permission from Elsevier.Citation59