Figures & data
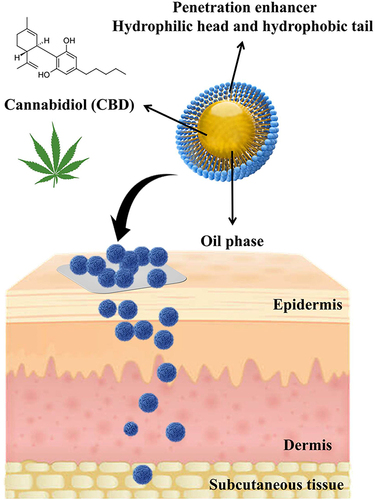
Figure 1 Ternary phase diagram. Light grey area represents the precipitate region, while the dark grey area represents the turbidity. Red area represents the milky region. Tween 80 = surfactant, Limonene = oil phase.
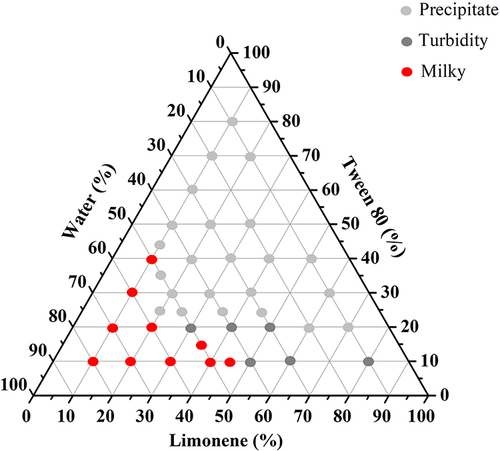
Figure 2 Morphology of different nano emulsion transdermal nanoparticle by TEM. (A) CTD-41. (B) CTD-12. (C) Schematic of the structural difference between CTD-41 and CTD-12. Arrows indicate the direction of change in formulation ratio.
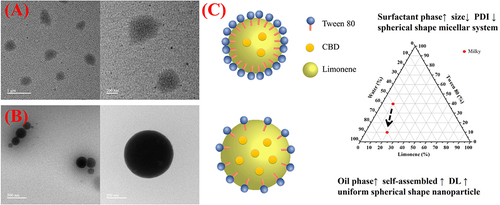
Table 1 Numerical Results of 0–24 hr Skin Permeation for Free CBD, 6% Tween 80, CTD-41 and CTD-12
Figure 3 (A) Cumulative CBD content (B) Flux (C) Permeation ratio of Free CBD, 6% Tween 80, CTD-41 and CTD-12 during 0–24 hr at skin permeation experiment.
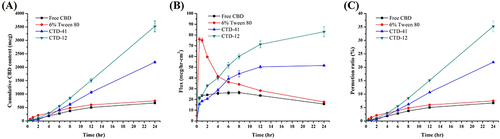
Table 2 Numerical Results of 0–24 hr Skin Permeation for Free CBD Patch and PCTD-12
Figure 4 (A) Cumulative CBD content (B) Flux (C) Permeation ratio of Free CBD patch and PCTD-12 during 0–24 hr at skin permeation experiment.
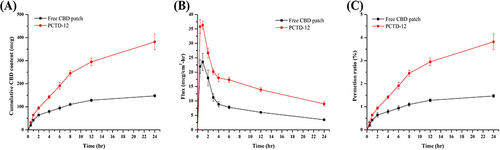
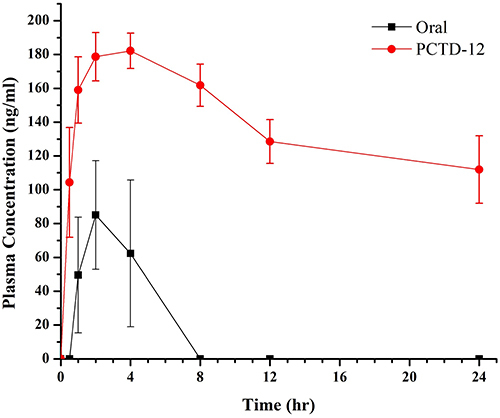
Table 3 Numerical Results of 0–24 Hr Plasma Concentration Curve of Oral and PCTD-12
Figure 5 Plasma concentration curve of oral and PCTD-12 for 0–24 hours.