
Figures & data
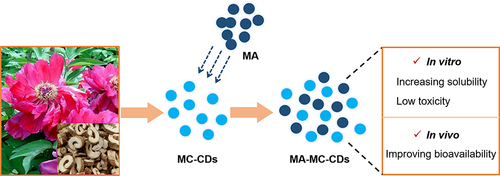
Figure 1 Preparation scheme of Moutan Cortex-Carbon dots (MC-CDs).
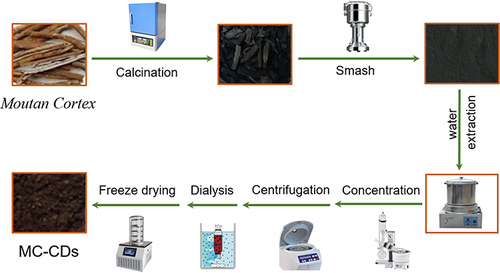
Figure 2 Characteristics of MC-CDs. (A) Transmission Electron Microscope (TEM) of MC-CDs. (B) TEM size distribution of MC-CDs. (C) High Resolution Transmission Electron Microscope of MC-CDs. (D) Lattice spacing of MC-CDs in HRTEM. (E) Ultraviolet-visible spectroscopy (UV-Vis) of MC-CDs. (F) Fourier-transform infrared spectrometer (FTIR) of MC-CDs. (G) XRD pattern of MC-CDs. (H) Zeta potential values of MC-CDs.
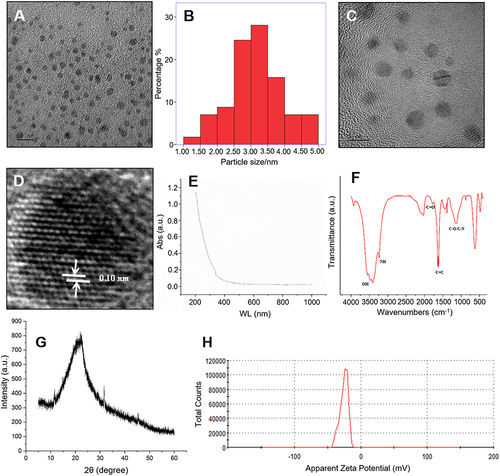
Figure 3 The XPS of MC-CDs. (A) Full-survey XPS data. (B) The high-resolution C1s spectrum. (C) The high-resolution O1s spectrum. (D) The high-resolution N1s spectrum.
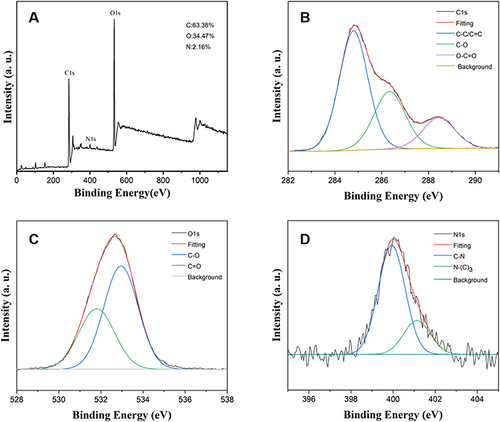
Figure 4 Luminescence properties of MC-CDs. (A) Emission and excitation wavelength fluorescence spectra. (B) Excitation spectra of the MC-CDs at emission wavelengths. (C) Emission spectra of the MC-CDs at different excitation wavelengths.
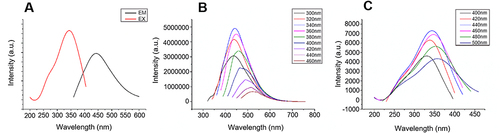
Figure 5 Cytotoxicity in HT-22 cells. All data are presented as the mean ± SD. #P < 0.05, **P < 0.01 between two groups.
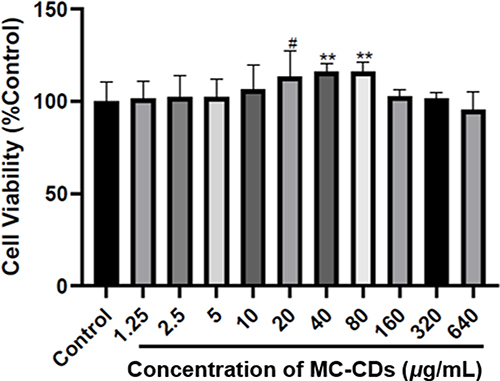
Figure 6 Concentration profiles of MA in the aqueous MC-CDs solutions.
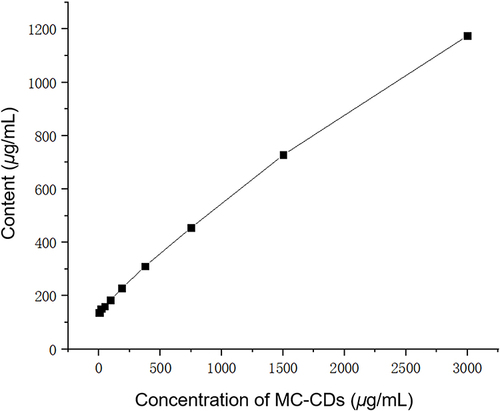
Table 1 Pharmacokinetic Parameters of MA in Rats After Oral Administration of MA Control and MA-MC-CDs
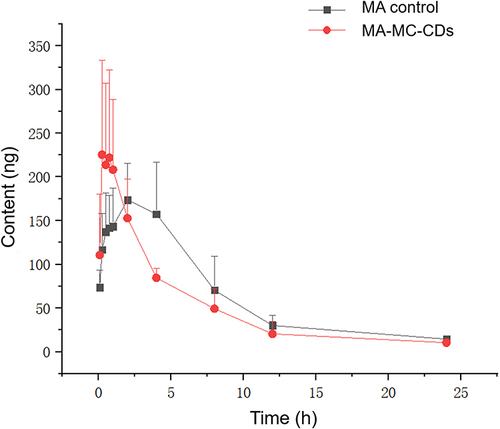
Figure 7 Effects of MC-CDs on the blood concentration-time curve of MA.
Data Sharing Statement
The data supporting the findings of this study are available upon request from the corresponding author.