Figures & data
Figure 1 Characterization of PVGLIG-MTX-Que-Ms. (A) The variations in fluorescence intensity ratio (I372/I384) as a function of the concentration of PVGLIG-MTX-Que-Ms. (B) Transmission electron microscope (TEM) image of PVGLIG-MTX-Que-Ms. Scale bar, 100 nm. (C) Hemolysis of induction of PVGLIG-MTX-Que-Ms. (D) Particle size distribution of PVGLIG-MTX-Que-Ms. (E) Zeta potential distribution of PVGLIG-MTX-Que-Ms. (F) Encapsulation rate of micelles. (G) Quantitative analysis of particle size of micelles. (H) Quantitative analysis of zeta potential distribution of micelles. (I) Quantitative analysis of PDI value of micelles. (J) Release rate of quercetin from the varying formulations. (K) Change of encapsulation efficiency of PVGLIG-MTX-Que-Ms of 7 days. (L) Change of particle sizes and PDI value of PVGLIG-MTX-Que-Ms of 7 days. Data are presented as mean ± SD (n=3). a, Blank-Ms. b, Que-Ms. c, MTX-Que-Ms. d, PVGLIG-MTX-Que-Ms. e, PVGLIG-MTX-Que-Ms in MMP-2 enzyme-rich environment.
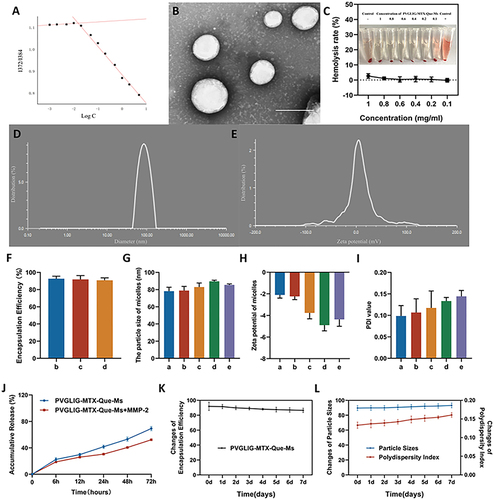
Figure 2 Cell viability and calcein-AM/PI staining assays on RAW264.7 cells after incubation with varying formulations. (A) The growth curves of free drugs and micelles of RAW264.7 cells at varying concentrations of Que. (B) Statistical analysis of IC50 values of varying formulations. 1, 2, 3, 4, vs Que. P<0.05. (C) Calcein-AM/PI staining assays after incubation with varying formulations. Data are presented as mean ± SD (n=3). 1, Que-Ms. 2, MTX-Que-Ms. 3, PVGLIG-MTX-Que-Ms. 4, PVGLIG-MTX-Que-Ms in MMP-2 enzyme-rich environment. 5, free Que.
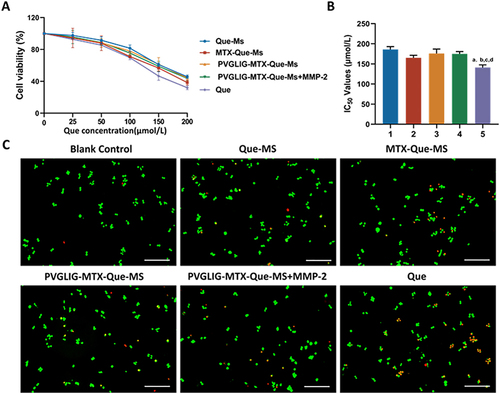
Figure 3 Cellular uptake and distribution after incubation with varying formulations. (A) Fluorescence microscopy images of RAW264.7 cells treated with or without LPS with different formulations. Scale bar, 25 μm (n=3). (B and C) Quantitative analysis of fluorescence intensity for different formulations. (D and E) The uptake of different formulations to cells treated without or with LPS. (F and G) Relative fluorescence intensity of varying formulations to cell. Data are presented as mean ± SD (n=3). * P < 0.05. a, Blank control. b, Cou-Ms. c, MTX-Cou-Ms. d, PVGLIG-MTX-Cou-Ms. e, PVGLIG-MTX-Cou-Ms in MMP-2 enzyme-rich environment.
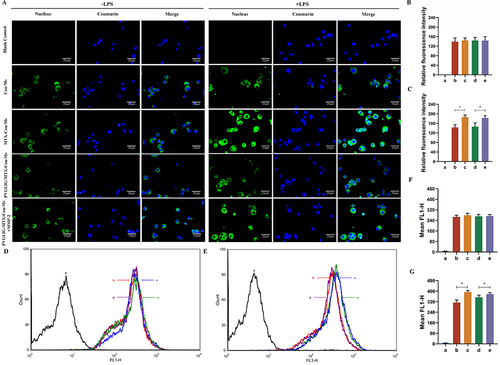
Figure 4 Effect on production of inflammatory cytokines and ROS generation assays of varying formulations on RAW264.7 cells. (A-C) TNF-α, IL-6, and IL-17 levels in the supernatant of RAW264.7 cells activated by LPS treated with varying formulations. Data are presented as mean ± SD (n=3). #, vs Blank Control; *, vs Model. P < 0.05. (D) Statistics of inhibitory effects of different dosage forms on ROS production in RAW264.7 cells. Data are presented as mean ± SD (n=3). #, vs Blank Control; *, vs Model. P < 0.05. (E) Inhibitory effects of formulations on ROS production in RAW264.7 cells. Scale bar, 50 μm. (n=3).
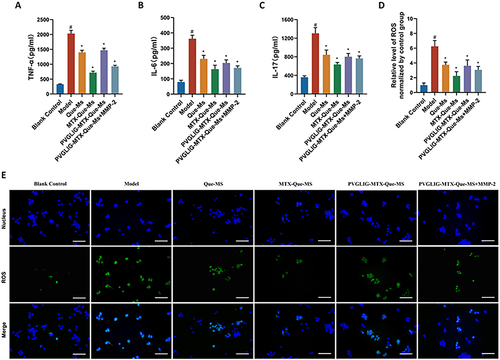
Figure 5 Real-time imaging observation of CIA rats after intravenous injection of different micelles.
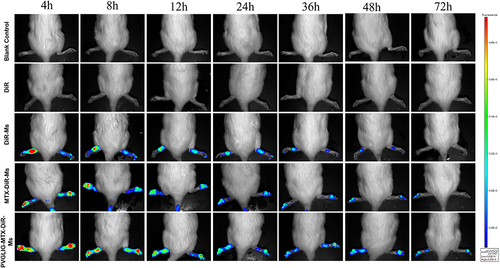
Figure 6 Anti-arthritic efficacy in CIA rats. (A) Representative photographs of hind paws at the end point of the experiment from each group. (B) Paw thickness of arthritic rats during the treatment of varying formulations. (C) Arthritis index score of arthritic rats during the treatment of varying formulations. (D-F) The levels of IL-17, IL-6, and TNF-α in the serum of CIA rats. #, vs Blank Control; *, vs Model. P < 0.05. Data are presented as the mean SD (n=6).
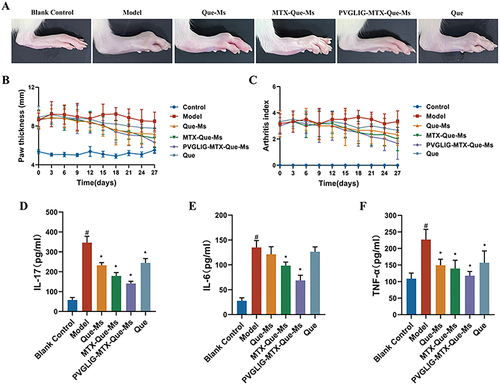
Figure 7 Histology analysis of cartilage sections in CIA rats. (A) HE staining of knee joint sections after treatment, scale bar, 100μm. (B) HE staining of ankle joint sections after treatment, scale bar, 100μm. (C) Safranin O staining of knee joint sections after treatment, scale bar, 100μm. (D) Safranin O staining of ankle joint sections after treatment, scale bar, 100μm. (E and F) Images of immunofluorescence results of CD44 and CD68 in cartilage sections after treatment, scale bar=50 μm. Data are presented as the mean SD (n=6).
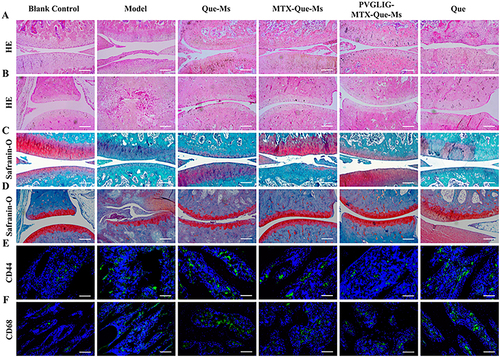
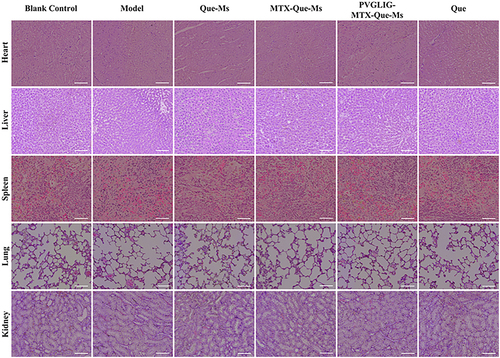
Figure 8 HE staining assay of major organs, scale bar=50 μm (n=6).