Figures & data
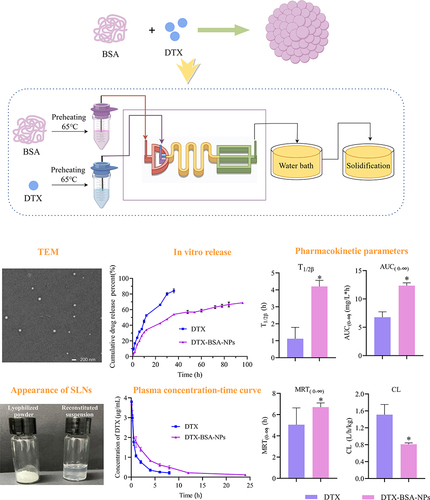
Figure 1 Flow chart of the preparation process of DTX-BSA-NPs through a microfluidic technology.
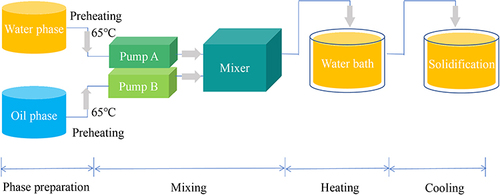
Figure 2 Effects of various factors on the particle size and EE of DTX-BSA-NPs. (A) the effect of mass ratio of DTX to BSA. (B) the effect of BSA concentration. (C) the effect of DTX concentration. (D) the effect of incubation temperature. (E) the effect of incubation time. (F) the effect of different buffer types. (G) the influence of preheating BSA. All data are presented as mean±SD (n = 3), with color bars indicating particle size and a line chart displaying EE.
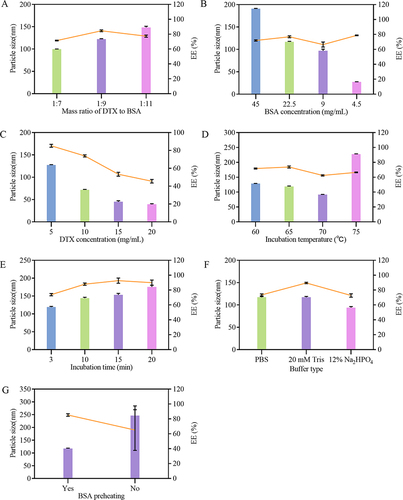
Figure 3 Effects of various factors on the DL of DTX-BSA-NPs. (A) the effect of mass ratio of DTX to BSA. (B) the impact of BSA concentration. (C) the effect of DTX concentration. (D) the effect of incubation temperature. (E) the impact of incubation time. (F) the effect of different buffer types. (G) the influence of BSA preheating. All data are presented as mean±SD (n = 3).
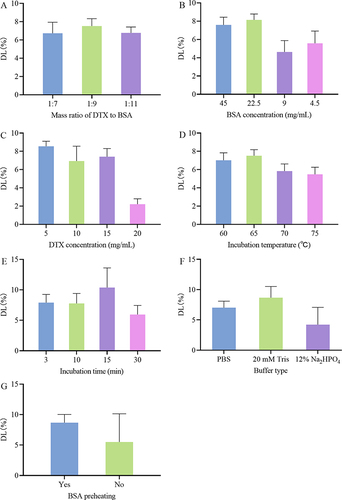
Table 1 Three-Factor and Three-Level Design of Orthogonal Test
Table 2 Results of Orthogonal Test on Particle Size
Table 3 Results of Orthogonal Test on EE%
Table 4 Results of Variance Analysis on Particle Size
Table 5 Results of Variance Analysis on EE%
Figure 4 Effects of Preparation process on DTX-BSA-NPs. (A and B) show the effect of flow rate and pump pressure on particle size and EE, with color bars indicating particle size and a line chart displaying EE. (C and D) show the effect of flow rate and pump pressure on DL. All data are presented as mean±SD (n=3).
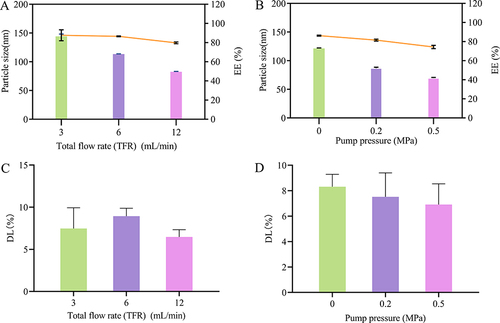
Figure 5 Batch-to-batch reproducibility and freeze drying stability of DTX-BSA-NPs. (A) the particle size and zeta potential of three different batches, with color bars indicating particle size and a line chart displaying zeta potential. (B) the EE and DL of three different batches, with color bars indicating EE and a line chart displaying DL. (C) the consistency in particle size and EE of freeze-dried NPs upon reconstitution, with color bars indicating particle size and a line chart displaying EE. (D) the consistency in DL of freeze-dried NPs upon reconstitution. (E) the particle size and EE before and after freeze drying, with color bars indicating particle size and a line chart displaying EE. (F) the DL of freeze-dried NPs before and after freeze drying. (G and H) the PDI of DTX-BSA-NPs before and after freeze drying. All data are presented as mean±SD (n=3).
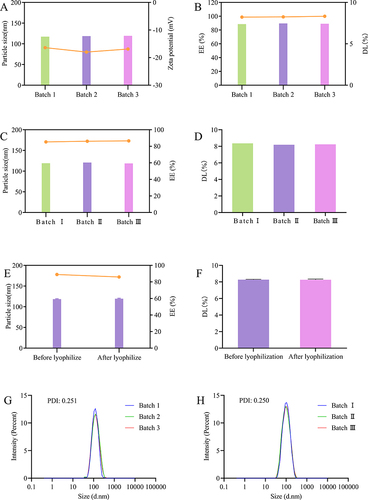
Figure 6 Appearance of freeze-dried powder and reconstituted suspension of DTX-BSA-NPs. (Left: freeze-dried powder; Right: reconstituted suspension).
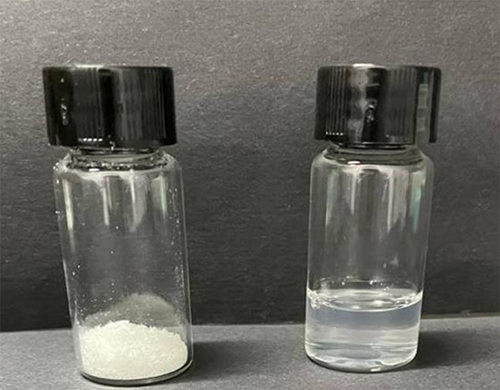
Figure 7 TEM images of DTX-BSA-NPs. Scale bar = 200 nm.
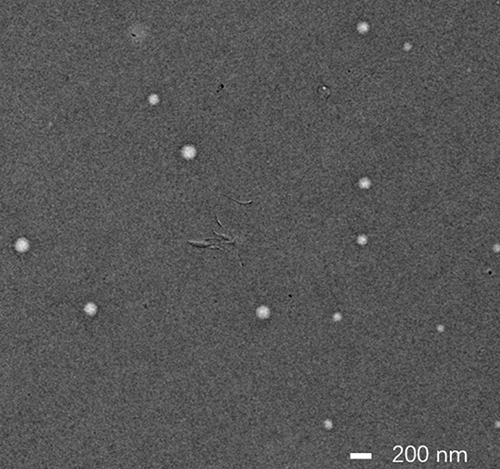
Figure 8 DSC spectra of (A) DTX, (B) BSA, (C) physical mixture of DTX, BSA and sodium gluconate, and (D) DTX-BSA-NPs.
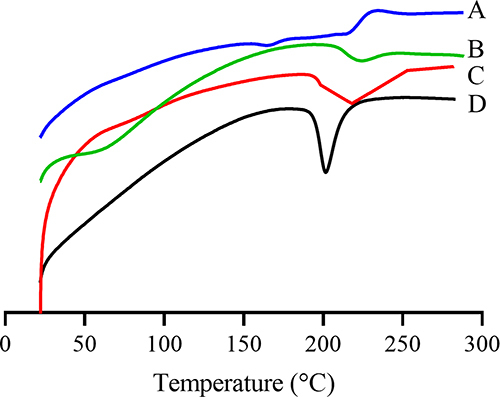
Figure 9 FT-IR spectra of (A) DTX, (B) BSA, (C) physical mixture of DTX, BSA and sodium gluconate, and (D) DTX-BSA-NPs.
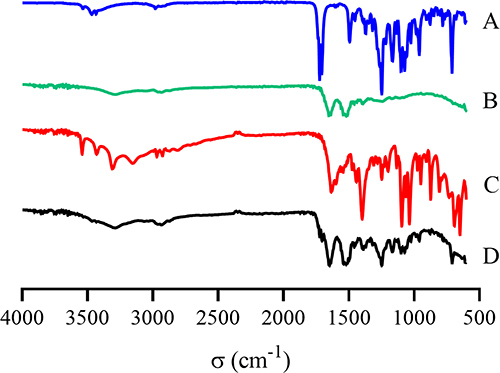
Figure 10 In-vitro release profiles of DTX-BSA-NPs and DTX. All data are presented as mean±SD (n=3).
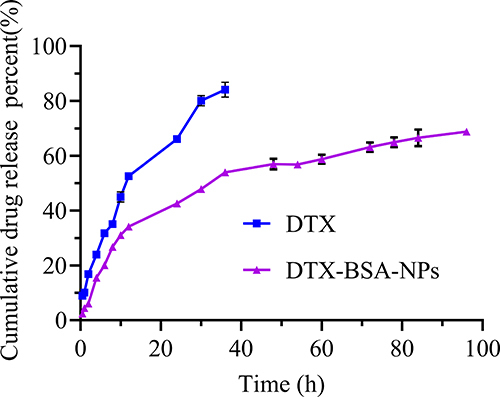
Figure 11 Stress test of commercial product (DTX) and DTX-BSA-NP powders. (A and B) illustrate the influence of strong light (4500±500 Lx) on pH value and content of DTX. (C and D) present the impact of high temperature (60±2°C) on pH value and content of DTX. (E and F) demonstrate the influence of high humidity (92.5±5% RH) on pH value and content of DTX. All data are presented as mean±SD (n=3).
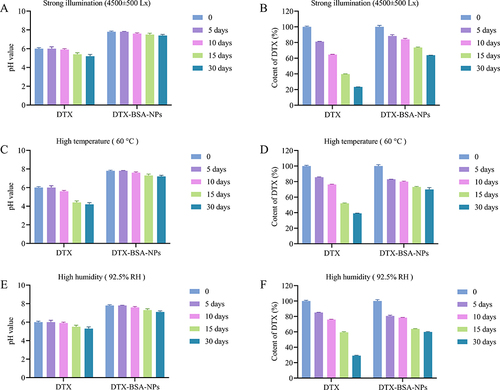
Figure 12 Accelerated test of DTX and DTX-BSA-NPs. (A and B) illustrate the changes in pH value and DTX content under storage at 25°C. (C and D) present the variation of pH value and DTX content at 40°C. All data are presented as mean±SD (n=3).
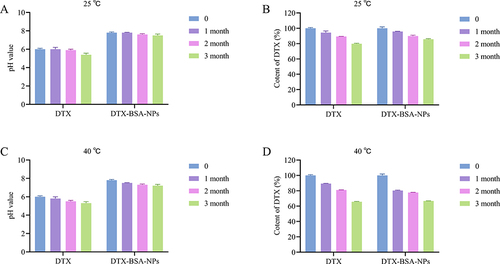
Figure 13 Pharmacokinetic profiles of DTX concentration over time following iv injection of DTX and DTX-BSA-NPs to SD rats (n=5).
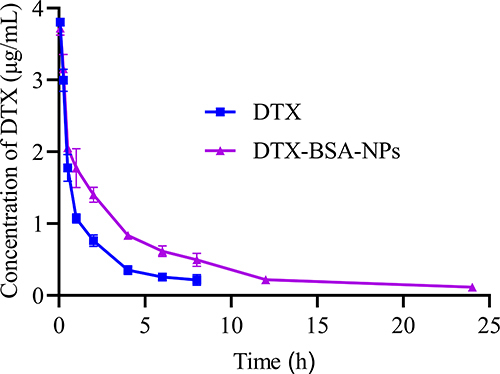
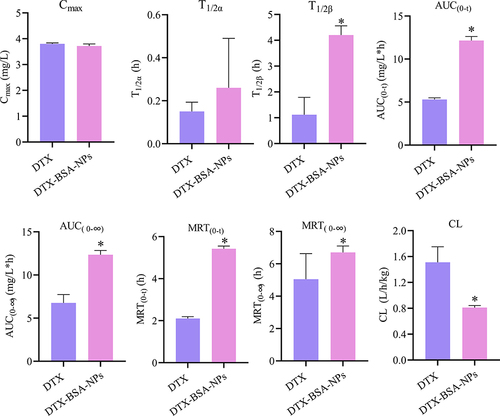
Figure 14 Pharmacokinetic parameters of DTX and DTX-BSA-NPs in SD rats (n=5), *p<0.05, significant difference compared with DTX group.