Figures & data
Figure 1 Characterization of scL-SMARCB1 nanocomplex. (A) Size distribution of scL-SMARCB1 nanocomplex, control nanocomplex containing a plasmid without the SMARCB1 insert (scL-vec), and empty nanocomplex, ie, lacking a DNA payload (scL). Shown are the data from analyses using a Malvern Zetasizer expressed as the number average values. (B) Zeta potential (surface charge) of nanocomplexes. (C) A compilation of the polydispersity index (PDI), size distribution (by number, volume, and intensity), and zeta potential values of nanocomplexes is shown (N = 3–5/nanocomplex).
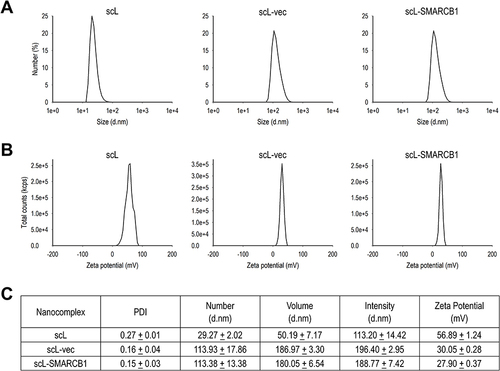
Figure 2 scL-SMARCB1 nanocomplex restores SMARCB1 expression in SMARCB1-deficient rhabdoid tumor cells. (A) Flow cytometric analysis of TfR expression on the surface of patient-derived ATRT (BT-12 and CHLA-06) and rhabdomyosarcoma (A-204). Median fluorescence intensity (MFI) is shown in top-right corners. (B) RT-qPCR analysis of transcriptional expression of SMARCB1 at indicated time after transfection with either scL-SMARCB1 or scL-vec (N = 4 for BT-12, N = 3 for CHLA-06 and A-204). **p<0.01. (C) Western blot analysis of SMARCB1 expression in BT-12 cells treated with either scL-SMARCB1 or scL-vec (left panel). A densitometric analysis of Western blot results presented (right panel).
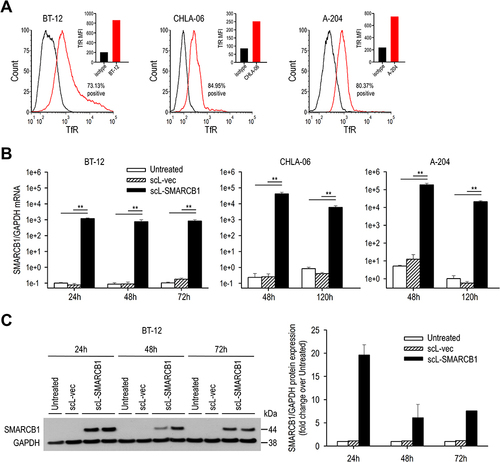
Figure 3 scL-SMARCB1 nanocomplex inhibits growth of SMARCB1-deficient rhabdoid tumor cells. SMARCB1-deficient ATRT (BT-12 and CHLA-06), SMARCB1-deficient rhabdomyosarcoma (A-204), and SMARCB1-expressing rhabdomyosarcoma (Hs729) were transfection with increasing concentrations of either scL-SMARCB1, scL-vec, or an empty nanocomplex without payload (scL). (A) XTT cell viability assay at 48h after transfection. A compilation of the IC50 values is shown (lower panel). (B) Induction of apoptosis was monitored via Annexin V/PI staining in A-204. Numbers in the quadrants indicate the percentage of cells in each quadrant. (C) Cell cycle analysis of BT-12. Sub-G1 peaks represent apoptotic cells. (D) Representative photographs of senescence-associated β-galactosidase staining of BT-12 and A-204. The scale bars indicate 100 μm. (E) Western blot analysis of senescence associated cell cycle inhibitors (CDKN1A and CDKN2A) in BT-12 cells (top panel). A densitometric analysis of Western blot results presented (lower panel).
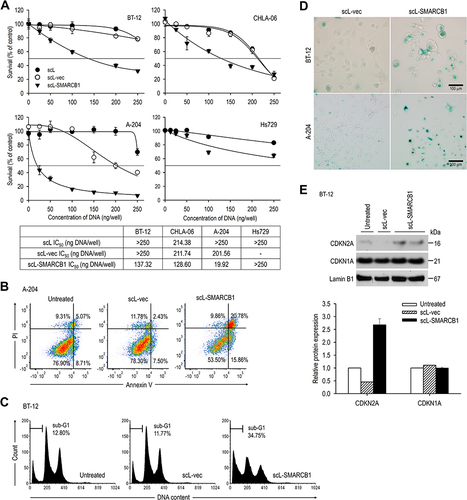
Figure 4 scL-SMARCB1 nanocomplex inhibits BT-12 tumor growth in vivo. Athymic mice with subcutaneous BT-12 tumor xenografts were randomized to therapy with scL-SMARCB1. (A) Treatment schedule. Mice received total 6 injections of scL-SMARCB1 (30 μg/injection, twice weekly for 3 weeks, N = 7 for untreated group, N = 8 for scL-SMARCB1 group). (B) Comparison of tumor growth between treatment groups. Tumor volumes are shown for individual tumor (left panel) and on average (right panel). Gray boxes indicate the treatment period. *p<0.05. (C) Quantification of tumor weight at harvest on day 43. *p<0.05. (D) Comparison of body weight changes between treatment groups.
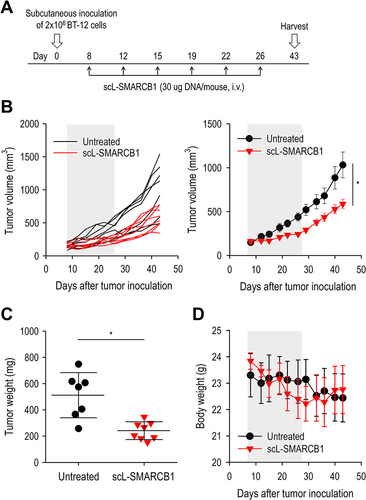
Figure 5 scL-SMARCB1 nanocomplex improves the survival of mice bearing intracranial BT-12 tumor. Athymic mice with intracranial BT-12 tumor xenografts were randomized to therapy with scL-SMARCB1 or scL-vec. (A) Treatment schedule. Mice received total 6 injections of scL-SMARCB1 (30 μg/injection, twice weekly for 3 weeks, N = 6/group). (B) Comparison of tumor growth between treatment groups (left panel). MRI images were evaluated to determine tumor volume. Representative MRI images (right panel). Gray box indicates the treatment period. *p<0.05. (C) MRI-based measurement of tumor volume on day 49. *p<0.05. (D) Comparison of body weight changes between treatment groups. (E) Kaplan–Meier survival curves of mice. Log Rank test, **p<0.01. N = 6/group. (F) RT-qPCR analysis of transcriptional expression of genes related to ATRT progression. *p<0.05.
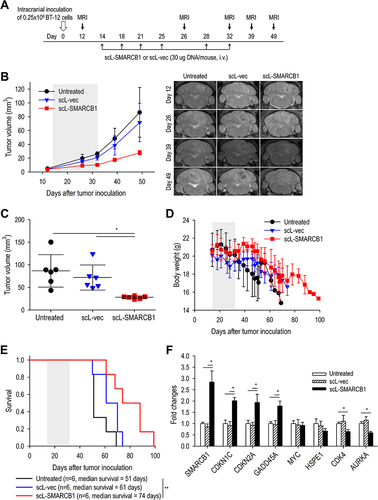
Figure 6 scL-SMARCB1 nanocomplex promotes cisplatin-induced cytotoxicity in ATRT. For in vitro study, SMARCB1-deficient ATRT (BT-12 and CHLA-06) and SMARCB1-deficient rhabdomyosarcoma (A-204) were transfected with either scL-SMARCB1 or scL-vec for 24h, followed by treatment with cisplatin at various concentration. (A) XTT cell viability assay at 72h after cisplatin treatment. (B) Annexin V/PI staining to monitor apoptosis in BT-12. Numbers in the quadrants indicate the percentage of cells in each quadrant. (C) Western blot analysis of SMARCB1 and apoptosis markers (cleaved PARP and cleaved Caspase3) in CHLA-06 cells. For in vivo study, athymic mice with intracranial BT-12 tumor xenografts were randomized to therapy with scL-SMARCB1 and/or cisplatin. (D) Treatment schedule. Mice received total 6 injections of scL-SMARCB1 (30μg/injection, twice weekly for 3 weeks) and/or total 3 injections of cisplatin (2 mg/kg, weekly for 3 weeks). (E) MRI-based measurement of tumor volume. Gray box indicates the treatment period. (F) Kaplan–Meier survival curves of mice. Log Rank test, *p<0.05. N = 4–6/group.
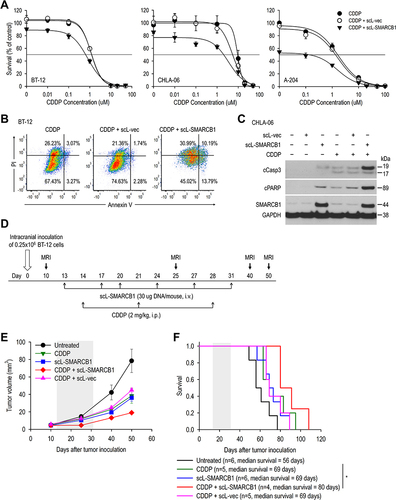
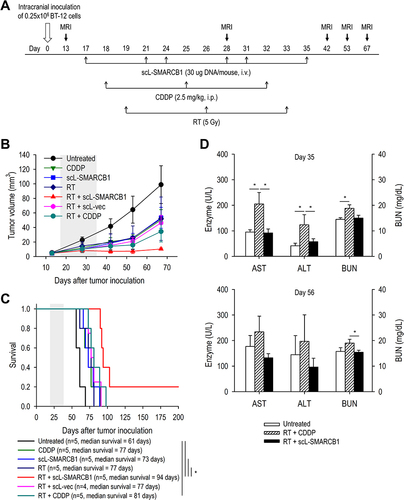
Figure 7 scL-SMARCB1 nanocomplex promotes radiation-induced cytotoxicity in ATRT. Athymic mice with intracranial BT-12 tumor xenografts were randomized to therapy with scL-SMARCB1 and/or radiation therapy. (A) Treatment schedule. Mice received total 6 injections of scL-SMARCB1 (30μg/injection, twice weekly for 3 weeks) and/or 3 fractions of radiation (5Gy, weekly for 3 weeks). Some animals also received total 3 injections of cisplatin (2mg/kg, weekly for 3 weeks) and/or 3 fractions of radiation (5Gy, weekly for 3 weeks). (B) MRI-based measurement of tumor volume. Gray box indicates the treatment period. (C) Kaplan–Meier survival curves of mice. Log Rank test, *p<0.05. N = 4–5/group. (D) Sera from tumor bearing mice receiving the indicated treatment were collected on day 35 (top panel) and day 56 (lower panel) and analyzed for levels of liver enzymes (AST and ALT) and BUN, indicators of hepatic and renal toxicity, respectively. *p<0.05. N = 4–5/group.