
Figures & data
Figure 1 Preparation and characterization of MM-Lip-Rg3/PNS. (A) Schematic preparation of RVG/TPP-MASLNs-GS. (B) Particle size of (I) Lip-Rg3/PNS and II) MM-Lip-Rg3/PNS. (C) Zeta potential of (I) Lip-Rg3/PNS and II) MM-Lip-Rg3/PNS. (D) Particle size and zeta potential of MM-Lip-Rg3/PNS with different ratios of membrane proteins to phospholipids ratios. (I) particle size, II) zeta potential. (E) Proteins in macrophage membrane, MM-Lip-Rg3/PNS, and Lip-Rg3/PNS, analyzed with SDS‐PAGE. (F) Size stability of Lip-Rg3/PNS and Lip-Rg3/PNS at (I) 4°C and II) room temperature. (G) Representative TEM image of MM-Lip-Rg3/PNS. (H) Western-blot analysis of macrophages, macrophage membranes, and MM-Lip-Rg3/PNS for its surface characteristic protein (CD47, CD11b). Data are presented as means ± SD, n = 3.
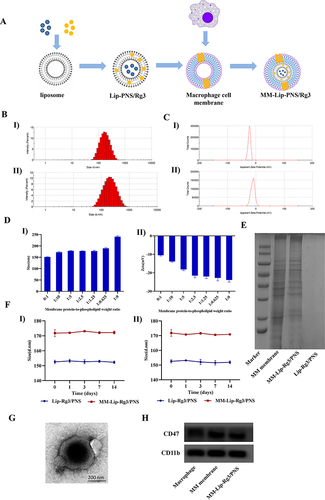
Figure 2 Inflammatory response and release profile of MM-Lipo in vitro. (A) The effect of LPS concentration on hCMEC/D3 cells survival rate. (B) ICAM-1 of hCMEC/D3 cells before and after LPS stimulation. (C) Fluorescence confocal images show the binding of DiD-labeled liposomes (red) to inflamed hCMEC/D3 cells stained by DAPI (blue). hCMEC/D3 cells were activated with LPS /without LPS (scalebar: 30 μm). The data were presented as the mean ± SD (n =3).
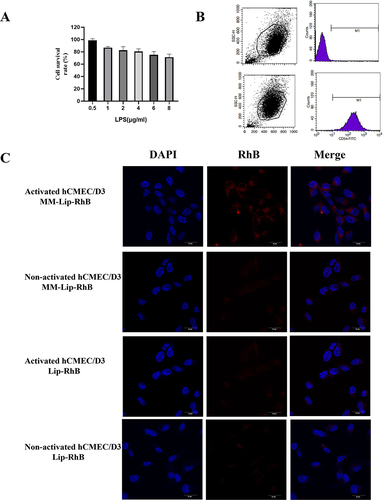
Figure 3 Immune-escape function in vitro. (A) Confocal laser microscope images of macrophages (blue) incubated with MM-Lip-RhB and Lip-RhB (red), (scale bar =30μm). (B) Cellular uptake of MM-Lip-RhB and Lip-RhB in macrophages by flow cytometry. (C) Quantification of the cellular uptake of MM-Lip-RhB and Lip-RhB in macrophages. The data were presented as the mean ± SD (n =3). ****p < 0.0001.
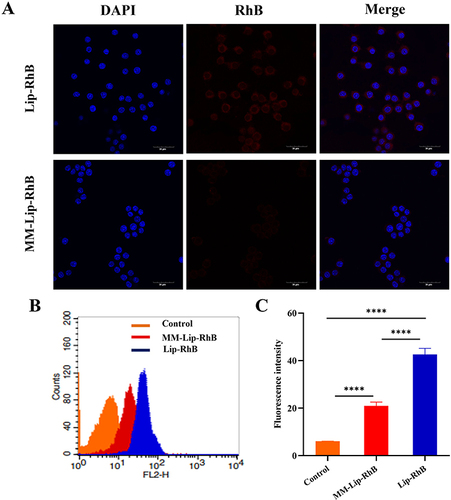
Figure 4 Efflux transporters on cellular uptake and BBB transmigration. (A) The cell viability of hCMEC/D3 cells after 24h treated with different concentrations of Rg3/PNS, Lip-Rg3/PNS, and MM-Lip-Rg3/PNS. (B) Schematic diagram of in vitro BBB model. (C) TEER value of BBB within 7 days. (D) hCMEC/D3 cells before and after treatment with efflux protein inhibitors were incubated with different formulations to determine the increase rate of PNS uptake. (E) hCMEC/D3 cells before and after treatment with efflux protein inhibitors were incubated with different formulations to determine the increase rate of Rg3 uptake. (F) The percentage of PNS crossing the BBB after incubation with different formulations, under LPS stimulation or non-stimulation conditions. (G) The percentage of Rg3 crossing the BBB after incubation with different formulations, under LPS stimulation or non-stimulation conditions. The data were presented as the mean ± SD (n =3). ****p < 0.0001, ***p < 0.001, **p < 0.01, *p < 0.05, ns no significant difference.
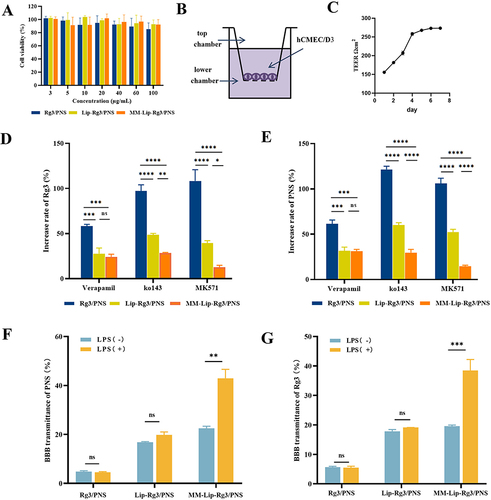
Figure 5 Observation of brain fluorescence after intranasal administration of MM-Lip-DiD formulations to olfactory nerve blockade model rats and normal rats. (A) Establishment of an olfactory nerve blockade model in rats. (B) Successfully modeled rats and normal rats. (C) Live imaging of MM-Lip-DiD distribution in the rat brain. (D) Ex vivo images of MM-Lip-DiD distribution in the rat brain. (E) Quantitative analysis of DiD fluorescence intensity in brain tissue. The data were presented as the mean ± SD (n =3). *p < 0.05.
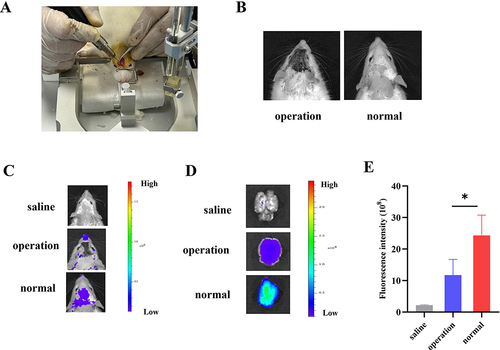
Figure 6 In vivo targeting research. (A) Schematic illustration of different preparations administered via the nose in MACO rats. (B) Live fluorescence imaging and ex vivo brain fluorescence images of MACO rats at 0.5, 1, 4, 12, and 24 hours after administration of MM-Lip-DiD. (C) EX vivo fluorescence imaging of brain of MACO rats that treated with free DiD, Lip-DiD and MM-Lip-DiD. (D) Quantitative analysis of DiD fluorescence intensity in brain tissue that treated with free DiD, Lip-DiD and MM-Lip-DiD. (E) Quantitative analysis of DiD fluorescence intensity of left and right brain. (F) EX vivo fluorescence imaging of heart, liver, spleen, lung and kidney of MACO rats that treated with free DiD, Lip-DiD and MM-Lip-DiD. (G) Quantitative analysis of DiD fluorescence intensity of heart, liver, spleen, lung and kidney. The data were presented as the mean ± SD (n =3). ***p < 0.001, **p < 0.01.
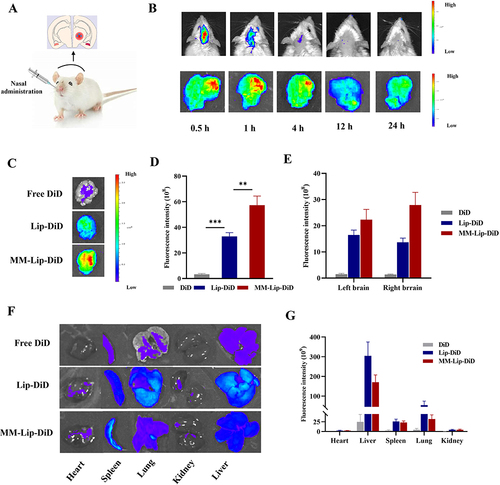
Figure 7 Fluorescence co-localization images of MM-Lip-DiD and microglia, Iba-1: green, MM-Lip-DiD: red, DAPI: blue (scale: 500/50 μm).
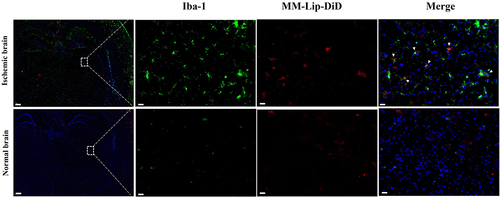
Table 1 Pharmacokinetic Parameters of Rg3 in Plasma After Intranasal Administration of Different Formulations (n=3)
Table 2 Pharmacokinetic Parameters of Rg1 in Plasma After Intranasal Administration of Different Formulations (n=3)
Table 3 Pharmacokinetic Parameters of Rb1 in Plasma After Intranasal Administration of Different Formulations (n=3)
Figure 8 Concentration–time curve of Rg3, Rg1 and Rb1 in MACO rats after intranasal administration of Rg3/PNS, Lip-Rg3/PNS, and MM-Lip-Rg3/PNS. The data were presented as the mean ± SD (n =3).
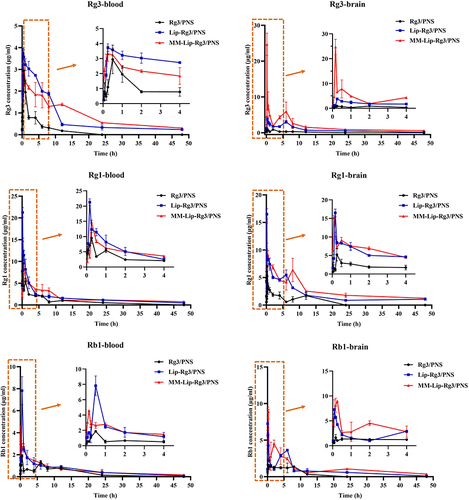
Table 4 Pharmacokinetic Parameters of Rg3 in Brain After Intranasal Administration of Different Formulations (n=3)
Table 5 Pharmacokinetic Parameters of Rg1 in Brain After Intranasal Administration of Different Formulations (n=3)
Table 6 Pharmacokinetic Parameters of Rb1 in Brain After Intranasal Administration of Different Formulations (n=3)
Table 7 The Brain Tissues Targeting Parameters of Rg3 After Intranasal Administration of Different Formulations (n=3)
Table 8 The Brain Tissues Targeting Parameters of Rg1 After Intranasal Administration of Different Formulations (n=3)
Table 9 The Brain Tissues Targeting Parameters of Rb1 After Intranasal Administration of Different Formulations (n=3)
Figure 9 Cerebral ischemia treatment with different formulations 14 days in MCAO rats. (A) The experimental scheme. (B) Representative TTC staining images of coronal sections. (C) Quantified infarct ratio. (D) Quantified brain water content. (E) Expression of TNF-α, IL-6, and IL-10 in the ischemic brain after different treatment. The data were presented as the mean ± SD (n =3). ****p < 0.0001, ***p < 0.001, **p < 0.01, *p < 0.05.
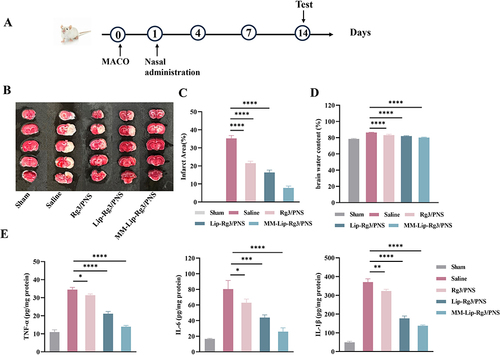
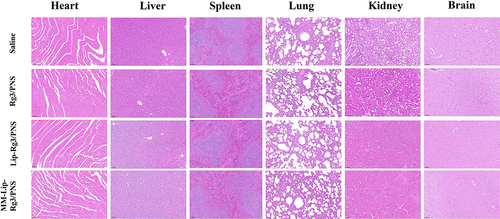
Figure 10 H&E staining of main organs including heart, liver, spleen, lung, kidney, brain. (scale bar = 100 μm).
Data Sharing Statement
All data supporting the findings of this study are presented graphically or in tables in this manuscript.