Figures & data
Figure 1 Characterization of fullerenols. (A) Schematic diagram of the fullerenols characterization and detection process. (B) Hydrodynamic size distribution and ζ potential of fullerenols. (C) XPS is scanning the spectrum of fullerenols. (D) XPS C1s are scanning the spectrum of fullerenols. (E) FT-IR spectrum of fullerenols.
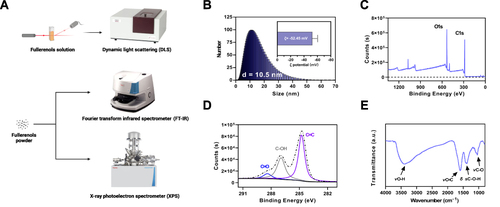
Figure 2 Fullerenols treatment reversed social deficits in BTBR mice but did not improve repetitive behavior. (A) Representative heat maps showing the total time and position of C57 and BTBR mice in a 10-minute three-chamber social test. The redder the hue, the longer the mouse spends exploring it. “S” and “O” represent the novel mouse and object, respectively. (B) In the three-chamber test, fullerenols or SAL did not affect the sociability of C57 mice, which stayed longer in the side chamber of the novel mice. BTBR mice showed low interest in the lateral chambers of novel mice, while fullerenols treatment significantly improved the social deficits of BTBR mice. (C) In the three-chamber test, SAL and fullerenols-treated C57 mice spent more time sniffing novel mice, while the time spent sniffing novel mice of BTBR mice showed a decreasing trend. Notably, fullerenols treatment increased the time for BTBR mice to sniff novel mice. (D and E) The preference index from chamber time (D) and sniffing time (E) of BTBR mice was significantly restored to the C57 mice after fullerenols treatment. (F and G) The time of self-grooming (F) and the number of buried marbles (G) in BTBR mice were more than those in C57 mice, and fullerenols treatment did not change the self-grooming time and the number of marbles buried in BTBR mice. Data are presented as mean ± SEM. N = 9. *P < 0.05, **P < 0.01, ***P < 0.001, ****P< 0.0001.
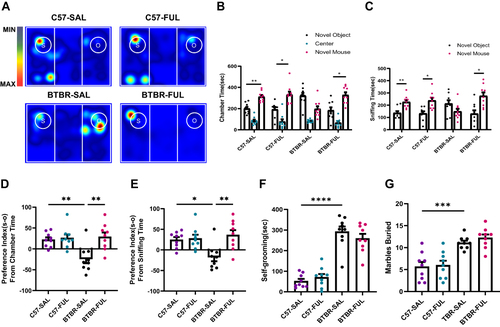
Figure 3 Fullerenols can ameliorate the deficits of male-female reciprocal social interaction in BTBR mice. (A–D) The nose-to-nose (A), nose-to-body (C), and social sniffing time (D) of BTBR mice were significantly lower than those of C57 mice but did not include nose-to-anogenital time (B). After fullerenols treatment, the nose-to-nose sniffing time of BTBR mice showed an increasing trend (A). In contrast, the nose-to-anogenital (B), nose-to-body (C), and social sniffing time (D) were markedly increased. Data are presented as mean ± SEM. N = 9. *P < 0.05, **P < 0.01.
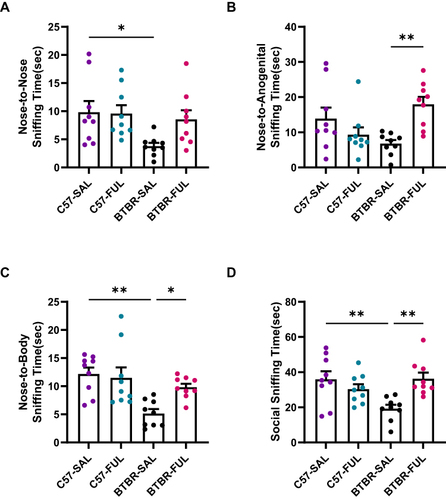
Figure 4 Fullerenols improved short-term memory deficits in BTBR mice without affecting working memory. (A) Representative heat maps show the time C57 and BTBR mice spent exploring objects in a novel object recognition task. “A” and “B” represent familiar and novel objects. (B) The recognition index of BTBR mice was lower than that of C57 mice, which was reversed by fullerenols treatment. (C) There was no significant difference in SAPs in the Y-maze test among the four groups. Data are presented as mean ± SEM. N = 9. **P < 0.01.
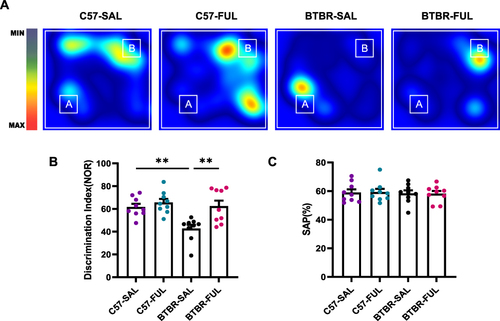
Figure 5 Fullerenols treatment did not alter the exploratory locomotion and anxiety level of C57 and BTBR mice in the open-field test. (A) Representative trajectory diagrams of four groups of mice in the open-field test within 30 minutes. (B) Total distance traveled in 30 minutes. (C) The distance traveled by the segment per 5 minutes. (D) BTBR mice had less center time in the open-field, and fullerenols treatment did not affect the total 30 minutes of center time spent by C57 and BTBR mice. (E) The 30-minute central time was divided into six 5-minute segments. Data are expressed as mean ± SEM. N = 9. *P < 0.05, **P < 0.01, ****P < 0.0001.
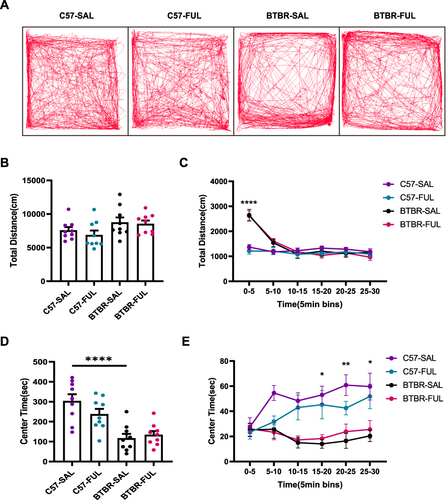
Figure 6 Fullerenols treatment increased the DCX+ cells in the DG and DCX protein levels in the hippocampus of BTBR mice. (A-D) Representative images of DCX-positive cells in the DG of four groups of mice. (E-P) Immunolabeled DCX (red), DAPI (blue), and DCX+/DAPI+ images at high magnification. (Q) Representative Western blotting of DCX in mouse hippocampus in each group. (R) Quantification of DCX protein level in the hippocampus. (S) Quantification of the number of DCX+ cells in the DG. The number of DCX+ cells in the DG and protein expression in the hippocampus of BTBR mice were significantly lower than those in C57 mice, which were rescued by fullerenols intervention. Data are presented as mean ± SEM. N = 3–5. The scale bar = 20 μm is shown in Figure D and applied to A-D. The scale bar = 10 μm is shown in Figure P and applied to E-P. *P < 0.05, **P < 0.01, ****P < 0.0001.
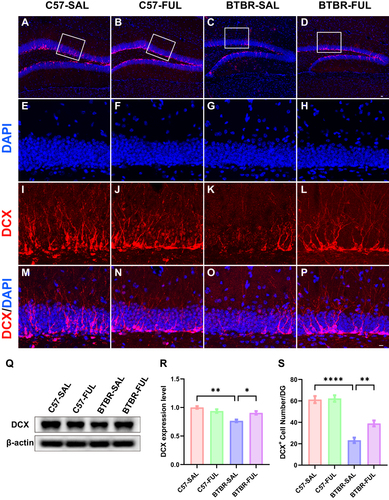
Figure 7 Fullerenols treatment restored the NPC pool in the DG of the BTBR mouse. (A–D) Representative images of SOX2+/GFAP+ double-positive NPCs in the DG of four groups of mice. (E–H) High-magnification of the selected area. (I–T) Immunostaining of DAPI (blue), SOX2 (red), and GFAP (green). (U) Quantification of the number of SOX2+ cells in the DG. (V) Quantification of SOX2+/GFAP+ cells in the DG. Data are presented as mean ± SEM. N = 5. The scale bar = 20 μm is shown in Figure D and applied to (A–D). The scale bar = 10 μm is shown in Figure T and applied to (E–T). **P < 0.01, ***P < 0.001.
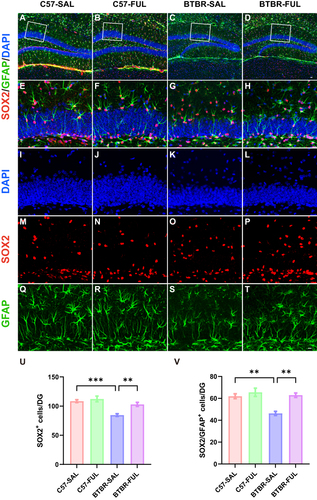
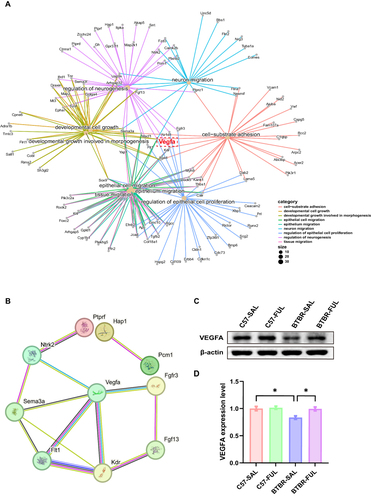
Figure 8 Fullerenols altered the hippocampus transcriptome in four groups of mice. (A) Hierarchical clustering gene expression heatmap of the four groups of mice. (B) Venn diagram for the treatment of co-regulated DEGs by fullerenols. (C) The top 15 GO pathways in BP enrichment. (D) HUB genes in neurogenesis regulatory pathways. (E) RT-qPCR verification of HUB genes in the regulatory pathways of neurogenesis (Vegfa: genotype effect: F (1, 8) = 8.740, P = 0.0182; drug effect: F (1, 8) = 4.033, P = 0.0795; genotype × drug interaction effect: F (1, 8) = 11.23, P = 0.0101. Sema3a: genotype effect: F (1, 12) = 44.98, P < 0.0001; drug effect: F (1, 12) = 2.494, P = 0.1403; genotype × drug interaction effect: F (1, 12) = 7.387, P = 0.0187. Kdr: genotype effect: F (1, 8) = 70.41, P < 0.0001; drug effect: F (1, 8) = 3.682, P = 0.0913; genotype × drug interaction effect: F (1, 8) = 9.470, P = 0.0152. Flt1: genotype effect: F (1, 12) = 17.61, P = 0.0012; drug effect: F (1, 12) = 7.021, P = 0.0212; genotype × drug interaction effect: F (1, 12) = 9.987, P = 0.0082. Ntrk2: genotype effect: F (1, 8) = 24.72, P = 0.0011; drug effect: F (1, 8) = 13.56, P = 0.0062; genotype × drug interaction effect: F (1, 8) = 11.56, P = 0.0094), the data are presented as mean ± SEM, N = 3–4, *P < 0.05, **P < 0.01, ***P < 0.001.
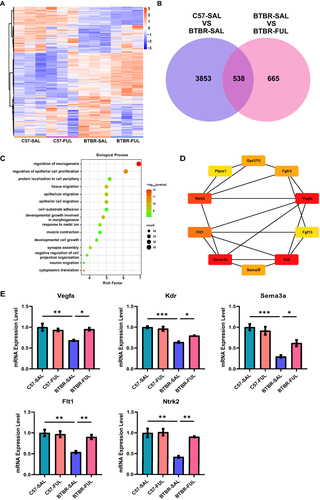
Figure 9 The effects of fullerenols on bridge gene Vegfa in the hippocampus. (A) Gene-Concept Network of related biological processes of GO terms. (B) A PPI network was constructed using the STRING online tool to regulate neurogenesis terms. (C) Representative western blotting of VEGFA in DG region of mice in each group. (D) The density of critical protein VEGFA was quantified, N = 3, and the data are presented as mean ± SEM, *P < 0.05.