Figures & data
Figure 1 Basic concept of couplings and dependencies between the different PBPK models.
Abbreviation: PBPK, physiologically based pharmacokinetic.
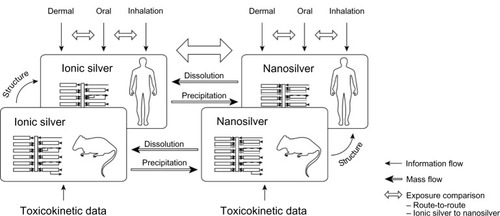
Figure 2 Schematic diagram of the PBPK model structures for (A) ionic and (B) nanoparticulate silver, which were used both for rats and humans.
Note: In the ionic silver model no transport of silver from the brain to the blood was modeled, to consider the blood–brain barrier.
Abbreviations: MPS, mononuclear phagocyte system; PBPK, physiologically based pharmacokinetic.
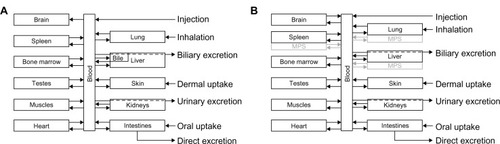
Figure 3 Metabolism of ionic silver and nanosilver and the connection between the PBPK models. For the fate of silver nanoparticles two scenarios were considered: (1) dissolution, and (2) direct storage as silver sulfide.
Abbreviation: PBPK, physiologically based pharmacokinetic.
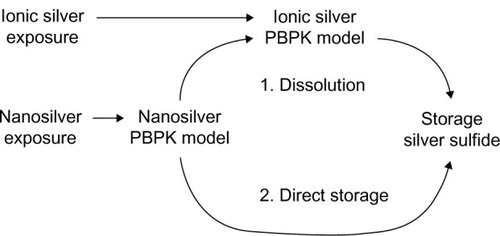
Figure 4 Comparison of the PBPK model simulations to toxicokinetic data of rats after oral exposure for 28 days.
Notes: (A) 30 (a), 300 (b), and 1000 (c) mg/kg/day 60 (52.7–70.9) nm particles,Citation31 (B) 12.6 mg/kg/day 14 ± 2 nm particles (11% ionic fraction),Citation49 and (C) 9 mg/kg/day silver acetateCitation49 without (a) and with (b) consideration of the formation of nanoparticles in the GI-tract. Light grey: female rats; dark grey: male rats; black: nanosilver; white: ionic silver; *intestinal absorption fractions were fitted to match blood silver levels (listed in Table S7); °transformation of soluble silver salts to silver nanoparticles within the digestive tract. Error bars represent standard deviations; n = 5 to n = 10. Data fromCitation31,Citation49.
Abbreviations: PBPK, physiologically based pharmacokinetic; NP, nanoparticle; Ag, silver; GI, gastrointestinal.
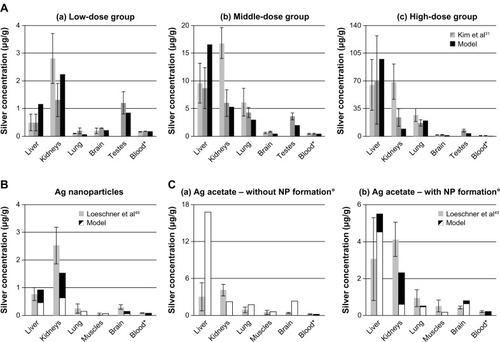
Figure 5 Comparison of the PBPK models to toxicokinetic data of rats after inhalation or instillation of silver.
Notes: (A) (a-d) Exposure once for 6 hours to 133 μg/m3 14.6 ± 1.0 nm particles.Citation36 (B) Exposure 6 hours/day and 5 days/week for 28 days to 61.24 μg/m3 14.77 ± 0.11 nm particles.Citation65 (C) Intratracheal instillation of 7.0 μg AgNO3.Citation36 Light grey: female rats; dark grey: male rats; black: nanosilver; white: ionic silver. *Pulmonary absorption fractions were fitted to match blood/liver silver levels (listed in Table S8), pulmonary clearance fractions were calibrated to match lung silver levels (listed in Table S8). Error bars represent standard deviations; n = 4 or n = 5. Data fromCitation36,Citation65.
Abbreviations: LOD, below limit of detection; ND, not determined by the authors; PBPK, physiologically based pharmacokinetic.
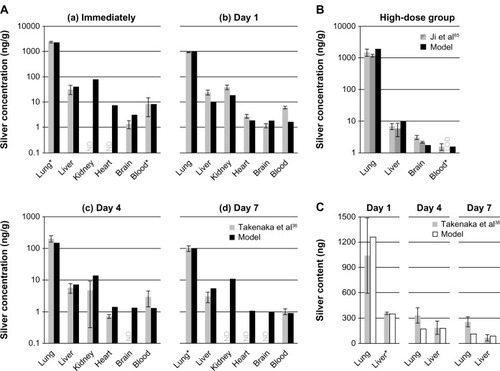
Figure 6 Comparison of the PBPK models to human toxicokinetic and biomonitoring data.
Notes: (A) Organ silver reference values of the USA,Citation40 (B) organ silver levels of deceased burn victims treated with silver nitrate,Citation69 and (C) biomonitoring data from worker occupationally exposed to silver in air.Citation63 *Dietary intake (A) and dermal absorption fractions (B) were fitted to match kidney’s silver levels. Error bars represent standard deviations; n = 25 to n = 30. Data fromCitation40,Citation63,Citation69.
Abbreviations: ICRP, International Commission on Radiological Protection; LOD, limit of detection; PBPK, physiologically based pharmacokinetic.
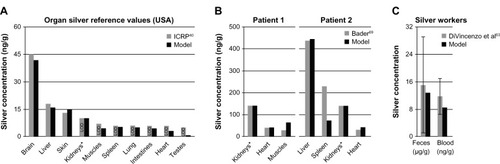
Figure 7 Comparison of the silver biodistribution with the human PBPK models.
Notes: It was assumed that 15 μg silver are released directly to the blood stream during 1-week (eg, from catheter). (A) Release of ionic silver. (B) Release of silver nanoparticles.
Abbreviation: PBPK, physiologically based pharmacokinetic.
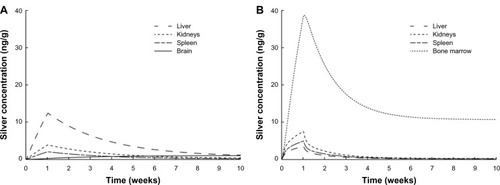
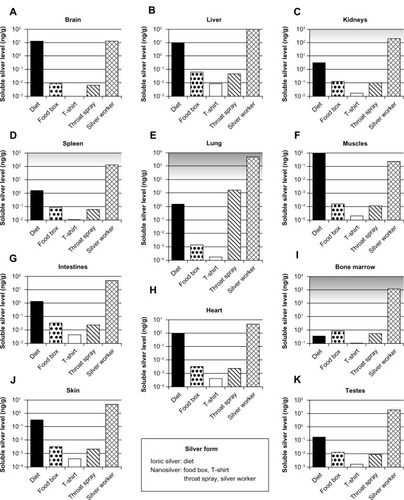
Figure 8 Calculated silver levels in human tissues without insoluble silver species using our PBPK models.
Notes: The scenarios above (A–K) exposure under a variety of conditions in different organs. Diet: dietary intake of 90 μg ionic silver per day. Food box: oral intake of 4.2 μg silver nanoparticles per day released from a commercially available food box. T-shirt: dermal exposure to 363 μg silver nanoparticles per day (for 0.5 hours) released from a commercially available T-shirt into 120 mL (artificial) alkaline sweat. Throat spray: inhalation of silver nanoparticles released from a commercially available colloidal silver throat spray. Daily inhaled silver dose was assumed to be 556 ng, which results from ten spray actions. Silver worker: silver worker exposed to 15 nm particles in air. The concentration in air was set to 55 μg per m3. The exposure scenario was calculated for 8 hours a day and 5 days a week for a worker who is doing light exercise and breathes through the mouth. Grey-shaded areas indicate silver levels where adverse effects have been reported in vitro. Light grey: sporadic reports. Dark grey: repeated reports. (Arranged on the basis of the dietary organ silver level: from high to low.)
Abbreviation: PBPK, physiologically based pharmacokinetic.