Figures & data
Table 1 Time evolution of the hydrodynamic diameter and zeta potential of 53 nm silica nanoparticles in different dispersion medium
Figure 1 Transmission electron microscopic image of 53 nm amorphous silica nanoparticles.
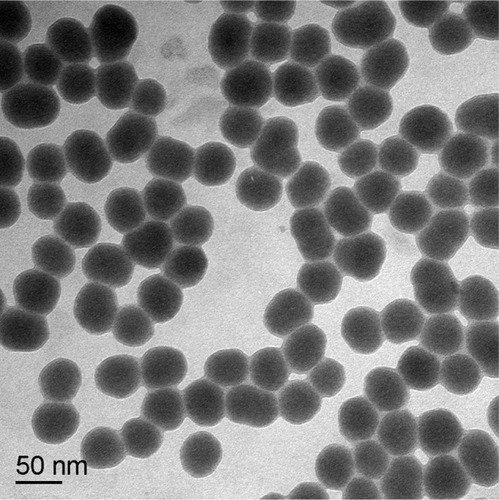
Figure 2 Viability of L-02 cells treated with different concentrations of silica nanoparticles for 24 hours. The results indicate that viability is reduced in a dose-dependent manner. Data are expressed as the mean ± standard deviation of three independent experiments. *P < 0.05 versus control group using analysis of variance.
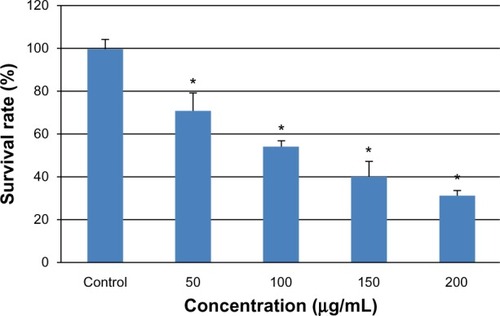
Table 2 Number of binucleated and multinucleated cells induced by silica nanoparticles
Figure 3 Multinucleation in L-02 cells induced by silica nanoparticles. (A) Control group and (B) group treated with100 μg/mL silica nanoparticles. The cell nucleus and cytoplasm were stained by Hoechst 33258 and fluorescein diacetate, respectively. Binucleated cells (arrows) and multinucleated cells (amplification) were observed.
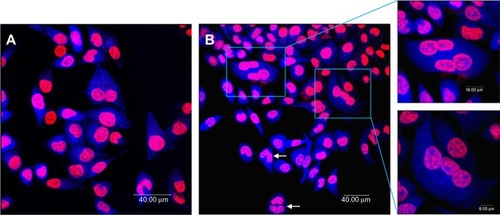
Figure 4 G2/M phase cell cycle arrest of L-02 cells induced by silica nanoparticles. After exposure to 50, 100, 150, and 200 μg/mL silica nanoparticles for 24 hours, the L-02 cell cycle was determined by flow cytometry. As the silica dose increased, the percentage of cells in G0/G1 phase decreased and the percentage of cells in G2/M phase increased significantly. Data are expressed as the mean ± standard deviation of three independent experiments. *P < 0.05 versus control group using analysis of variance.
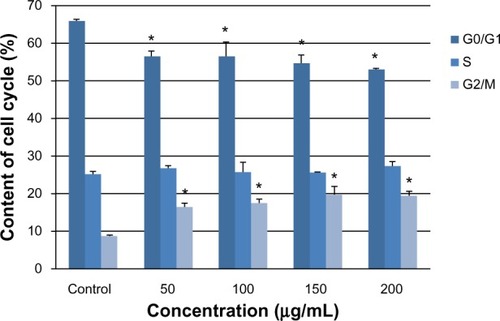
Figure 5 Change in intracellular ROS levels in L-02 cells after 24 hours of incubation with different concentrations of silica nanoparticles. The results of flow cytometry (A) and the corresponding bar graph (B) are shown. Intracellular ROS levels increased in a dose-dependent manner. Data are expressed as the mean ± standard deviation of three independent experiments. *P < 0.05 versus control group using analysis of variance.
Abbreviation: ROS, reactive oxygen species.
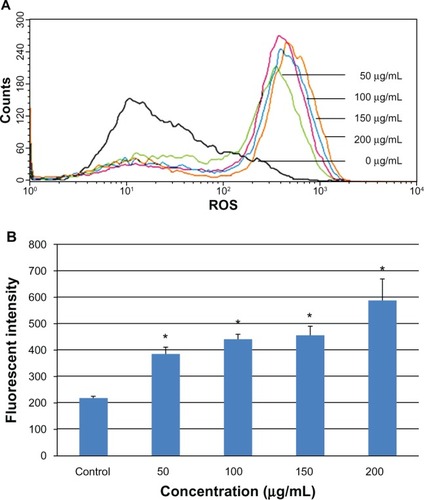
Figure 6 Mitochondrial damage to L-02 cells after exposure to different concentrations of silica nanoparticles for 24 hours detected by Mito-Tracker® green. (A) Control group, (B) group treated with 50 μg/mL silica nanoparticles, (C) group treated with 100 μg/mL silica nanoparticles, (D) group treated with 150 μg/mL silica nanoparticles, and (E) group treated with 200 μg/mL silica nanoparticles. The corresponding bar graph for flow cytometry is shown in (F). Mitochondrial damage increased in a dose-dependent manner. Data are expressed as the mean ± standard deviation of three independent experiments. *P < 0.05 versus control group using analysis of variance.
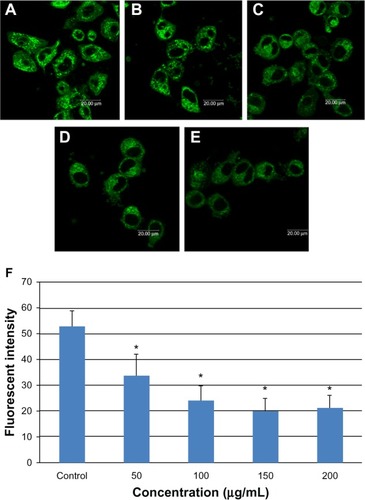
Figure 7 Apoptosis of L-02 cells after 24 hours of incubation with silica nanoparticles. Hoechst 33258 was used to observe morphologic changes in the cell nucleus. (A) Control group and (B) group treated with 100 μg/mL silica nanoparticles. Nuclear condensation (arrowhead) and chromatin margination (arrow) are seen in the silica nanoparticle-treated group. The corresponding bar graph for apoptotic rate detected by flow cytometry is shown in (C). Apoptosis induced by silica nanoparticles increased in a dose-dependent manner. Data are expressed as the mean ± standard deviation of three independent experiments. *P < 0.05 versus control group using analysis of variance.
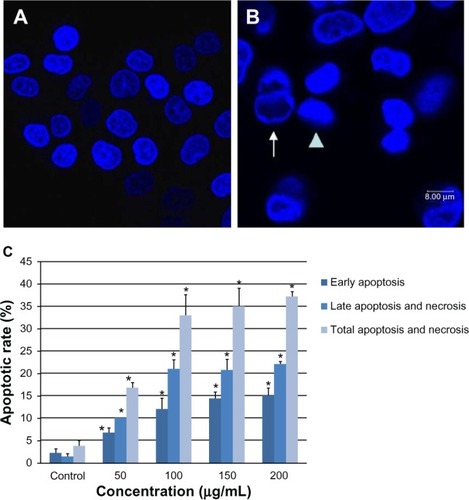
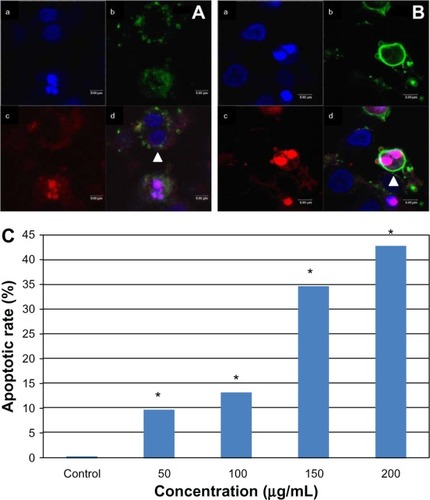
Figure 8 Apoptosis of multinucleated L-02 cells induced by silica nanoparticles. Early (A) and late (B) apoptosis of multinucleated cells was observed (arrowhead) in the group treated with100 μg/mL silica nanoparticles. (a) Hoechst 33258, (b) FITC-Annexin V (c) propidium iodide, and (d) merged image. The corresponding bar graph for apoptotic rate of multinucleated cells is shown in (C). The results indicate that the apoptotic rate of multinucleated cells also increased in a dose-dependent way. *P < 0.05 versus control group using Chi-square test.