Figures & data
Table 1 Particle size, zeta potential and EE% of blank (drug-free) NPs, SQV-NPs, and Ab-SQV-NPs
Table 2 ACE% and antibody loading of SQV-NPs
Figure 1 (A and B) Scanning electron microscope images of saquinavir-encapsulated nanoparticles (SQV-NPs) and antibody-conjugated saquinavir-encapsulated nanoparticles (Ab-SQV-NPs). Images were taken under a magnification of 3,000×. (A) SQV-NPs; (B) Ab-SQV-NPs.
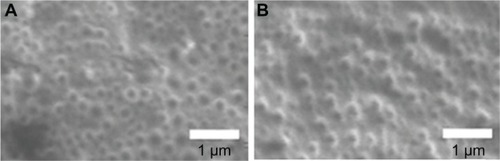
Figure 2 In vitro cumulative release profile of saquinavir from saquinavir-encapsulated nanoparticles. The results show cumulative concentration (filled diamonds) and percentage released (filled triangles) at 37°C in phosphate-buffered saline (pH 4.6). Values represent means ± standard deviation; n = 5.
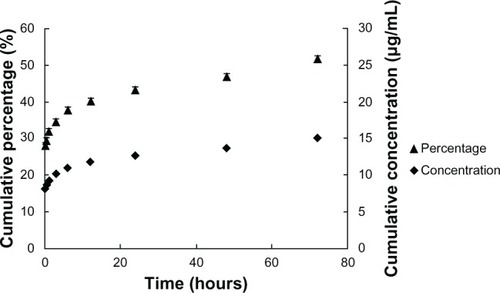
Figure 3 In vitro release study of saquinavir (SQV) from 1% hydroxyethylcellulose (HEC) gel loaded with SQV-encapsulated nanoparticles (A). Release study conducted in microcentrifuge tubes (B) release study conducted in Franz cells. The results show cumulative amounts (filled circles) and cumulative percentage released (filled squares) at 37°C in phosphate-buffered saline (pH 4.6). Values represent means ± standard deviation; n = 3.
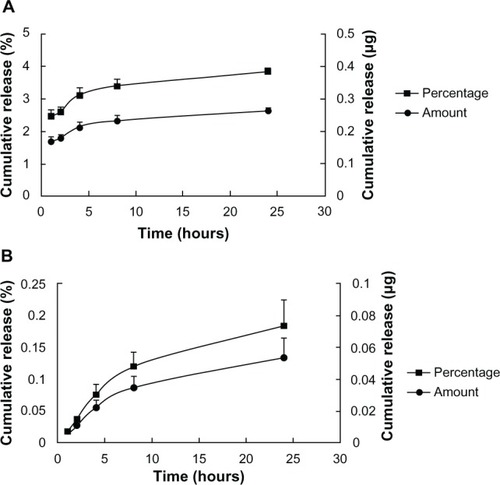
Figure 4 Steady-state flow curves of 1% hydroxyethylcellulose (HEC) placebo gel (filled diamonds), and 1% HEC gel containing antibody-conjugated saquinavir-loaded nanoparticles (Ab-SQV-NPs; 5 mg NPs/g gel, empty circles) at a measurement temperature of 37°C. Viscosity profiles were performed as a single measurement.
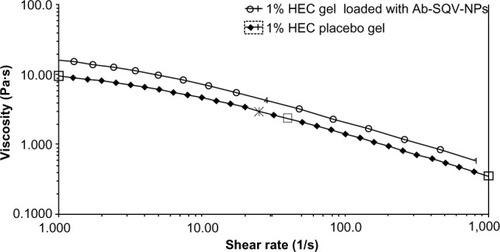
Figure 5 (A) Cytotoxicity of antibody-conjugated saquinavir-encapsulated nanoparticles (Ab-SQV-NPs) in Sup-T1 cells. The data shown represent means ± standard deviation; n = 4. (B) Intracellular accumulation of SQV in Sup-T1 cells, and (C) intracellular accumulation of SQV in VK2/E6E7 cells; values represent means ± standard deviation; n = 5.
Note: *P < 0.05 versus SQV-NPs.
Abbreviations: NC, negative control; PC, positive control.
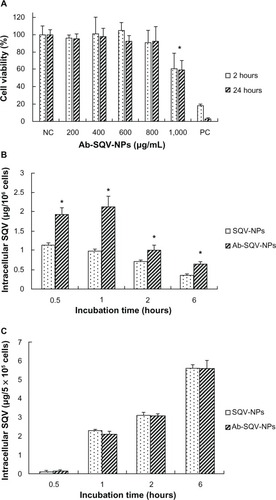
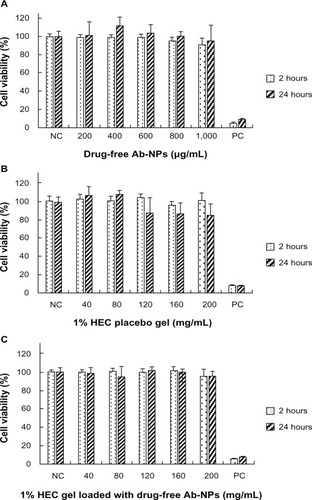
Figure 6 (A–C) Cell viability of VK2/E6E7 cells exposed to various treatments. (A) Drug-free Ab-NPs; (B) 1% hydroxyethylcellulose (HEC) placebo gel; (C) 1% HEC gel loaded with drug-free Ab-NPs (5 mg NPs/g gel).
Abbreviations: NC, negative control; NPs, nanoparticles; PC, positive control.