Figures & data
Table 1 The results of goat femur anatomical parameters (n = 6)
Figure 1 Schematic of self-designed loading device (left) and photo of device (right). The membrane tubes’ mechanical strength changed: after degradation of 3 months, six membrane tubes of each group were dried naturally in air, and then axial compression and three-point bending-stress tests were performed. The stress–strain curve was recorded. The pressure signal was recorded and analyzed by a computer data-acquisition system.
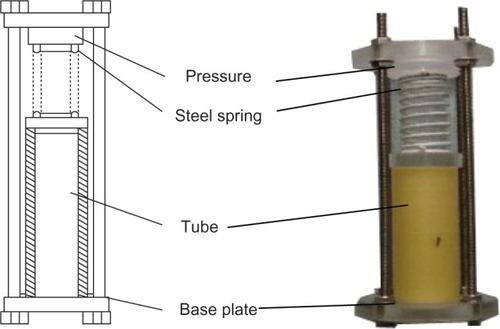
Table 2 Results of biomechanical experiments of the two groups
Figure 2 (A) Axial compression test of the straight tube; (B) stress–strain curve.
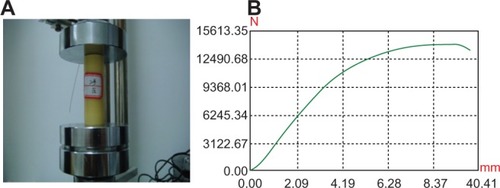
Figure 3 (A) Three-point bending test of the straight membrane tube; (B) stress– strain curve.
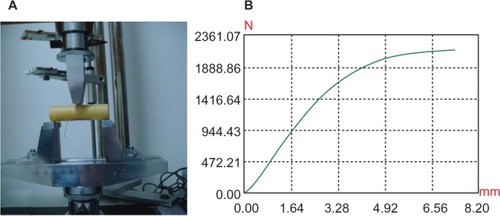
Figure 4 (A) Axial compression test of goat mid-femur; (B) stress–strain curve.
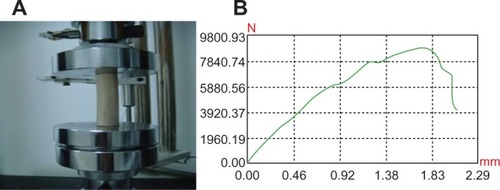
Figure 5 (A) Three-point bending test of the goat mid-femur; (B) stress–strain curve.
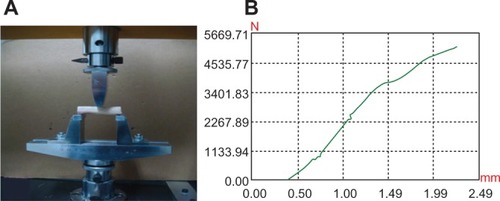
Figure 6 (A–D) Surface morphology of 50 N-loaded tube group (×1,000 magnification): changes in membrane tube-surface morphology, uneven knife marks, and particles on the surface. Surface morphology of the membrane tubes before degradation (A), and after 1 (B), 2 (C), and 3 (D) months’ degradation. Knife marks and uplift stripes gradually became smooth, with no cracks or damage.
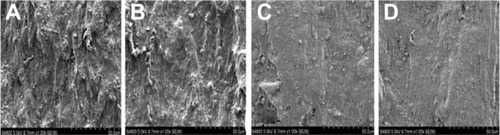
Figure 7 (A–D) Surface morphology of nonload group tube by scanning electron microscope (×1,000 magnification). Surface morphology of the membrane tubes before degradation (A), and after 1 (B), 2 (C), and 3 (D) months’ degradation. Knife marks and uplift stripes gradually became smooth, with no cracks or damage, but the degree of degradation was lower than the 50 N-loaded group.
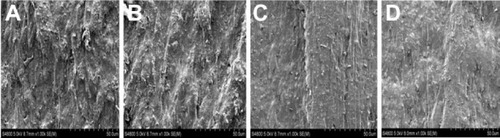
Figure 8 Scanning electron microscopy (×1,000 magnification) before degradation (A), and after 1 (B), 2 (C), and 3 (D) months’ degradation. The tubes’ internal cross-section had no substantial morphological changes during the degradation of 1, 2, and 3 months.
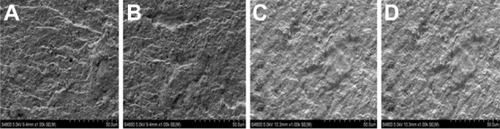
Figure 9 Fourier-transform infrared spectra of membrane tube before and after soaking. The membrane tubes in the phosphate-buffered saline degradation were removed to calculate the weight loss (%) after 1, 2, and 3 months. During the 3-month degradation, the weights of the membrane tubes had decreased, while the two loaded groups decreased significantly more quickly than the nonloaded group (P = 0.02). Compared to the 40 N-loaded group, the 50 N-loaded group of membrane tubes lost much more, but this was not statistically different (P = 0.92). Weight loss after 3 months’ incubation in phosphate-buffered saline is shown in . All groups showed rapid weight loss in 1 month, and then decreased slowly. The weight loss of the 50 N-loaded group was 3.27%, while the nonloaded group was lowest, with an average of 2.90%. In all observation periods, the weight loss of the 40 N- and 50 N-loaded groups was significantly different from the nonloaded group (P = 0.02).
Abbreviations: CN, carbon-nitrogen; NH, nitrogen-hydrogen; CH, carbon hydrogen; O=H, hydroxyl; N, loading force.
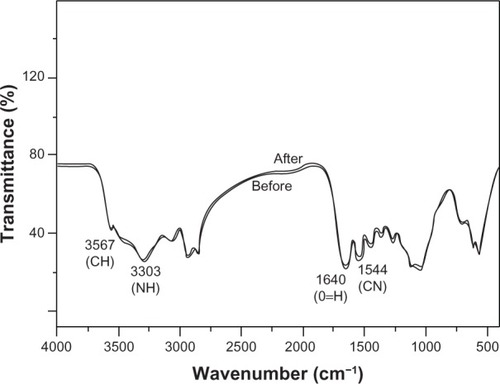
Table 3 Weight-loss rates of the different groups after incubation in phosphate-buffered saline for different periods (%)
Table 4 Biomechanical results of compressive strength and bending strength before and after 3 months’ soaking in PBS ( + SD MPa)