Figures & data
Figure 1 Characterization of titanium oxide nanoparticles. (A) Transmission electron microscopic image and (B) size distribution histogram generated using transmission electron micrography.
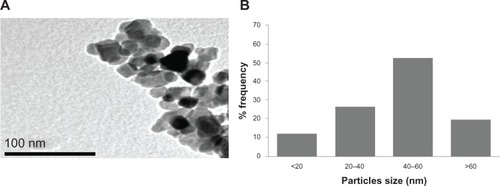
Figure 2 Levels of (A) alkaline phosphatase and (B) glutamate oxaloacetate transaminase after exposure of titanium oxide nanoparticles in the different experimental groups at 48 hours. Each value represents the mean ± standard error of three experiments. *P < 0.05 versus control.
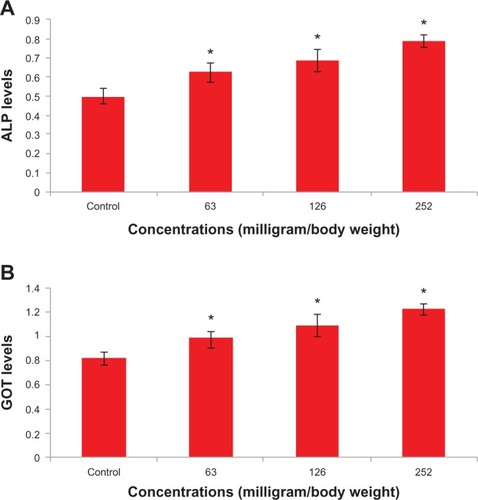
Figure 3 Light microphotographs of liver tissue.
Notes: (A) Male rats injected with Milli-Q water for 48 hours demonstrating normal histologic architecture. Hematoxylin and eosin, 400×. (B) Male rats 24 hours postexposure to titanium oxide nanoparticles (252 mg per animal) by intraperitoneal administration demonstrating lymphocytic infiltration (*) in the hepatic portal space. Hematoxylin and eosin, 400×. (C) Male rats 24 hours post-exposure to titanium oxide nanoparticles (252 mg per animal) by a single oral administration demonstrating marked dilatation of central vein. Hematoxylin and eosin, 400×. (D) Male rats 24 hours post-exposure to titanium oxide nanoparticles (252 mg per animal) by intraperitoneal administration demonstrating marked necrosis (*) and scattered hemorrhages. Hematoxylin and eosin, 400×. (E) Male rats 24 hours post-exposure to titanium oxide nanoparticles (252 mg per animal) by intraperitoneal administration demonstrating dilatation of congested portal vein with edema (*) around the blood vessel in the portal triad. Hematoxylin and eosin, 400×. (F) Male rats 24 hours post-exposure to titanium oxide nanoparticles (252 mg per animal) by intraperitoneal administration demonstrating dilatation and congestion of blood sinusoids (arrows) and binucleation of hepatocytes (circles). Hematoxylin and eosin, 400×. (G) Male rats 48 hours post-exposure to titanium oxide nanoparticles (252 mg per animal) by intraperitoneal administration demonstrating swelling of hepatocytes (arrows) and presence of nanoparticle beneath the capsule (*). Hematoxylin and eosin, 400×. (H) Male rats 48 hours post-exposure to titanium oxide nanoparticles (252 mg per animal) by intraperitoneal administration demonstrating vacuolization of hepatocytes. Hematoxylin and eosin, 400×. (I) Male rats 48 hours post-exposure to titanium oxide nanoparticles (252 mg per animal) by intraperitoneal administration, hydropic degeneration (ballooning) of hepatocytes and presence of nanoparticle in blood sinusoids (arrows). Hematoxylin and eosin, 400×. (J) Male rats 24 hours post-exposure to titanium oxide nanoparticles (126 mg per animal) by intraperitoneal administration demonstrating dilatation of congested portal vein with hemorrhage and edema (*) around the blood vessel and lymphocytic infiltration (arrow) in the portal triad. Hematoxylin and eosin, 400×. (K) Male rats 24 hours post-exposure to titanium oxide nanoparticles (126 mg per animal) by intraperitoneal administration demonstrating focal necrosis (*) and hydropic degeneration of hepatocytes (arrows). Hematoxylin and eosin, 400×. (L) Male rats 48 hours post-exposure to titanium oxide nanoparticles (126 mg per animal) by intraperitoneal administration demonstrating marked dilatation of congested central vein. Hematoxylin and eosin, 400×. (M) Male rats 48 hours post-exposure to titanium oxide nanoparticles (126 mg per animal) by intraperitoneal administration demonstrating dilatation of congested portal vein with edema (*) around the blood vessel in the portal triad. Hematoxylin and eosin, 400×. (N) Male rats 24 hours post-exposure to titanium oxide nanoparticles (63 mg per animal) by intraperitoneal administration demonstrating marked dilatation of congested central vein. Hematoxylin and eosin, 400×. (O) Male rats 48 hours post-exposure to titanium oxide nanoparticles (63 mg per animal) by intraperitoneal administration demonstrating focal necrosis (*) and hydropic degeneration of hepatocytes (arrows). Hematoxylin and eosin, 400×.
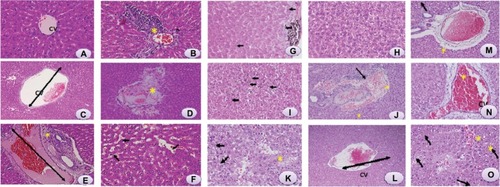
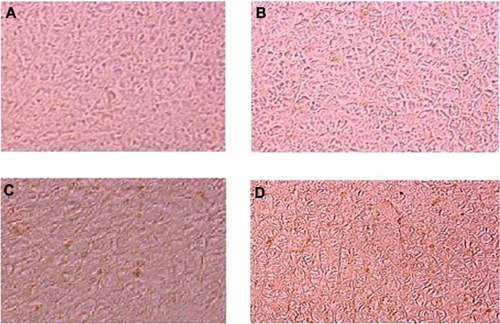
Figure 4 Photomicrograph of apoptosis in liver tissue after exposure of titanium oxide nanoparticles. (A) Control, (B) 63 mg per animal, (C) 126 mg per animal, and (D) 252 mg per animal.