Figures & data
Figure 1 (A and B) Schematic diagram of in situ tissue engineering model of rat middle-ear epithelium. (A) Donor cells (gray dots) were prepared from Sprague Dawley transgenic (SD-Tg) rats by explant culture and encapsulated within PuraMatrix before transplantation. (B) Donor cells were transplanted into the middle-ear bullae of recipient rats that had undergone surgical elimination of the middle-ear mucosa before transplantation. Creation of a small hole by surgical drill (arrow) (a); mucosa elimination (arrows) (b); before transplantation (c); transplantation of epithelial cells encapsulated within PuraMatrix (d); filling of the hole with bone wax (black circle) (e).
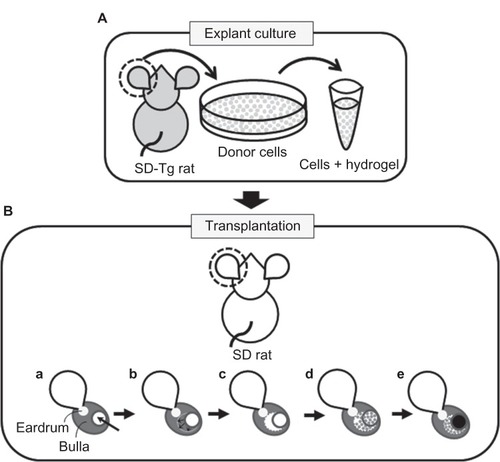
Table 1 List of primary antibodies used for immunohistochemistry
Figure 2 (A–E) Characterization of donor cells cultured by the primary explant-culture method. (A and B) Bright-field images and fluorescence images of donor cells by phase-contrast microscopy. Donor cells of Sprague Dawley transgenic rats showed a cobblestone appearance (A), and enhanced green fluorescent protein expression was stable up to the third passage (B). Scale bars, 100 μm. (C and D) Immunohistochemical analysis of donor cells collected by cytospin. The majority (98.6%) of donor cells were positive for pancytokeratin (C), with only a few positive for vimentin (D) at the third passage collected by cytospin. Scale bars, 20 μm. (E) In vitro cell-growth curve. The calculated doubling time was 22.1 hours.
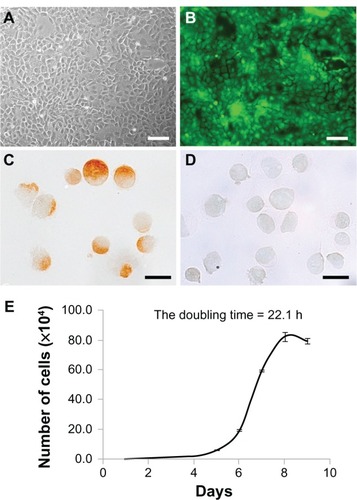
Figure 3 (A–I) Immunohistochemical analysis of the middle-ear of the recipients after mucosal tissue elimination before transplantation. (A, D and E) Anti-pancytokeratin; (B, F and G) anti-vimentin; (C, H and I) normal mouse immunoglobulin G. In the middle-ear lesion, vimentin-positive cells were detected (arrows in B and F), and only a few pancytokeratin-positive cells were present (A and D). In the external ear, pancytokeratin-positive cells were detected in the epithelial lesion (arrows in A and E), while vimentin-positive cells were detected in the subepithelial lesion (arrows in B and G). No staining was detected in sections reacted with normal mouse immunoglobulin G instead of the primary antibody (C–I).
Note: Arrowheads, tympanic membrane; arrows, positive cells; scale bars 100 μm (A–C), 50 μm (D–I).
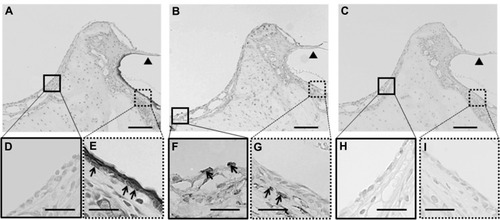
Table 2 Localization of EGFP-expressing cells after transplantation
Figure 4 (A–C) Hematoxylin and eosin staining of middle-ear bullae after cell transplantation at postoperative day 7. (A) Normal middle-ear bulla; (B and C) a middle-ear bulla in which the cells were transplanted with PuraMatrix at a density of 5.0 × 10⁵ cells/mL (B) or without PuraMatrix (C). (A) A monolayer structure of middle-ear mucosal epithelium was confirmed on the inner surface of the normal middle-ear bulla (arrows). (B) Epithelioid layer formation was identified on the surface of the subepithelial layer of the recipient middle-ear bulla in which the cells were transplanted with PuraMatrix (arrowheads). (C) No epithelioid layer formation was observed on the surface of the subepithelial layer of the recipient middle-ear bulla in which the cells were transplanted without PuraMatrix.
Note: Black asterisks, subepithelial layer; white asterisks, inner bone surface of the middle-ear bulla; scale bars, 20 μm.
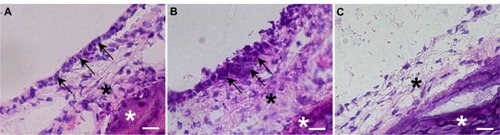
Figure 5 (A–K) Analysis of transplanted mucosal epithelial cells in the recipient tissues at postoperative day 7. (A–H) Serial frozen sections of middle-ear bullae after transplantation at a concentration of 0.5 × 10⁶ cells/mL Enhanced green fluorescent protein-expressing cells were found on the internal surface of the recipient middle-ear bullae under laser scanning microscope (green, enhanced green fluorescent protein; blue, 4′,6-diamidino-2-phenylindole) (A) and were localized on the surface of the subepithelial layer and compared with hematoxylin and eosin staining (B). These cells were positive for pancytokeratin (C, arrows) but not for vimentin (D). Collagen III-positive cells were detected mainly in the subepithelial layer (E) while collagen IV-positive cells were detected under the donor cells, resembling basement membrane (F) (arrowheads). Some epithelial cells were positive for periodic acid–Schiff staining (G, arrows). E-cadherin-positive cells were detected between adjacent epithelial cells (red, E-cadherin) (H). Scale bars, 20 μm. (I–K) Ultrastructural analysis. Scanning electron microscopy confirmed the morphology of the regenerating epithelial surface, which consisted of flat polygonal squamous cells (I), scale bar 50 μm. Transmission electron microscopy identified the formation of adhesion-junction-like structures between adjacent epithelial cells (J and K, white circle), scale bar 1 μm.
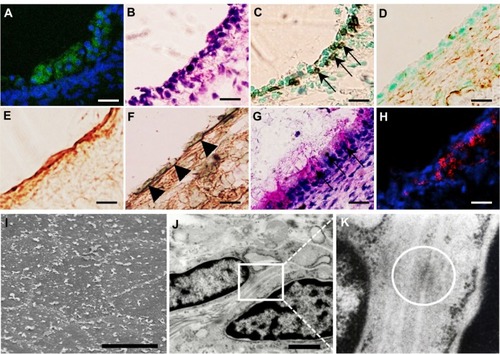
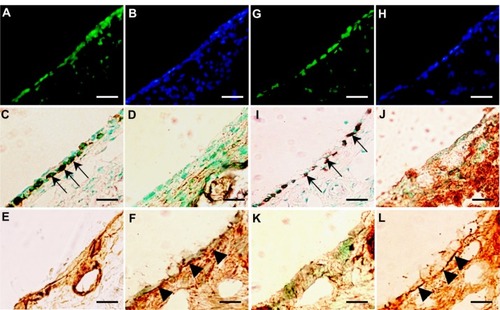
Figure 6 (A–L) Analysis of transplanted mucosal epithelial cells in recipient tissues at postoperative days 14 and 28. (A–F) Serial frozen sections of middle-ear bullae after transplantation (0.5 × 10⁶ cells/mL) at postoperative day 14, and (G–L) postoperative day 28. (A, B, G and H) Fluorescence images at several time points. Enhanced green fluorescent protein (EGFP)-expressing cells were detected on the internal surface of recipient middle-ear bullae (green, EGFP; blue, 4′,6-diamidino-2-phenylindole) (A and G). results of immunostaining with (C and I) anti-pancytokeratin, (D and J) anti-vimentin, (E and K) anti-collagen III, and (F and L) anti-collagen IV antibody. EGFP-expressing cells were positive for pancytokeratin (C and I, arrows), but not for vimentin (D and J). Collagen III-positive regions were detected mainly in the subepithelium (E and K). Collagen IV-positive regions were detected under the monolayer structure of donor cells at 14 and 28 days after transplantation (F and L, arrowheads). Scale bars, 50 μm.