Figures & data
Figure 1 The synthetic routes of tetravalent galactosylated diethylenetriaminepentaacetic acid-distearoylphosphatidylethanolamine (4Gal-DTPA-DSPE) conjugates.
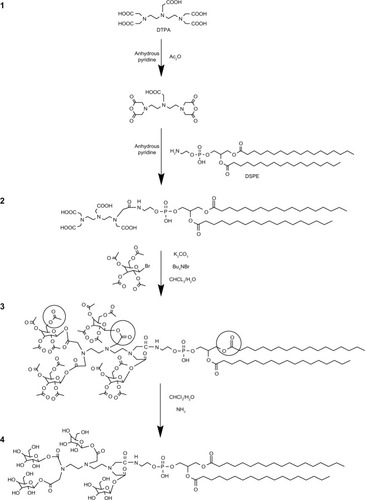
Table 1 Composition and physicochemical properties of the prepared liposomes
Figure 2 Negative stain (phosphotungstic acid) transmission electron microscopy image of four galactose-modified liposomes.
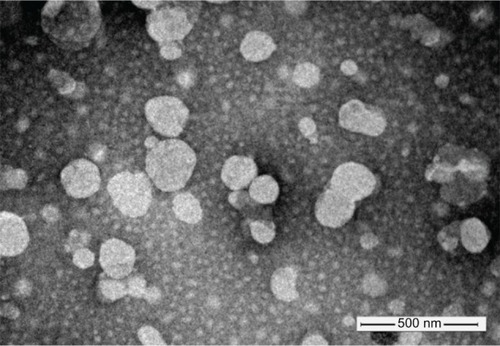
Figure 3 Confocal scanning microscopy images of HepG2 cells (A) and Hela cells (B) incubated with blank medium (A1 and A2), free doxorubicin (B1 and B2), conventional liposomes (C1 and C2), four galactose-modified liposomes (4Gal-liposomes) (5%) (D1 and D2), 4Gal-liposomes (10%) (E1 and E2), and 100 mM galactose + 4Gal-liposomes (10%) (F1 and F2) for 2 hours at 37°C. Cells were fixed and then treated with 4′,6-diamidino-2-phenylindole for nuclei staining. Red: fluorescence of doxorubicin. Blue: fluorescence of 4′,6-diamidino-2-phenylindole. Pink: the merger fluorescence of blue and red.
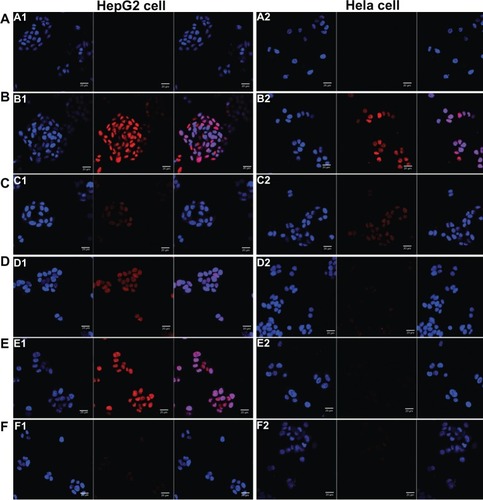
Figure 4 Flow cytometry analysis (A) of HepG2 cells (a) and Hela cells (b) after incubating with free doxorubicin (DOX) and DOX liposomes for 2 hours with 10% fetal bovine serum medium. The relative fluorescence intensity (B) of free DOX and DOX liposomes in HepG2 cells (a) and Hela cells (b) after incubating with 10% fetal bovine serum medium for 2 hours using flow cytometry analysis (n = 3), **P < 0.05.
Abbreviation: 4Gal-liposomes, four galactose-modified liposomes.
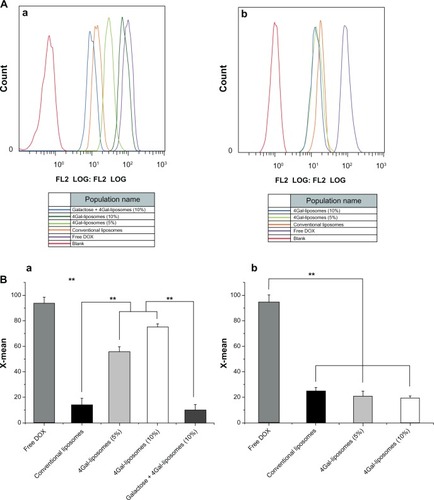
Figure 5 Relative inhibition of free doxorubicin (DOX) and DOX liposomes incubated in HepG2 cells (A) and Hela cells (B) with serum for 24 hours (n = 3). **P < 0.05, ***P < 0.01.
Abbreviation: 4Gal-liposomes, four galactose-modified liposomes.
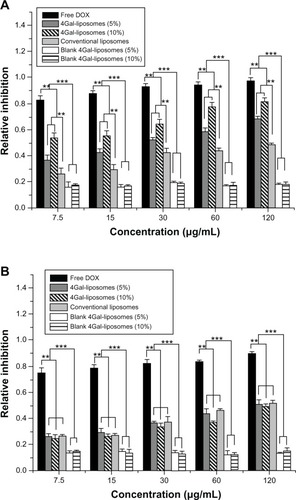
Figure 6 Plasma concentrations of doxorubicin (DOX) in normal mice after intravenous injection of free DOX, conventional liposomes, and four galactose-modified liposomes (4Gal-liposomes) (10%). All groups were given a DOX equivalent dose of 10 mg/kg.
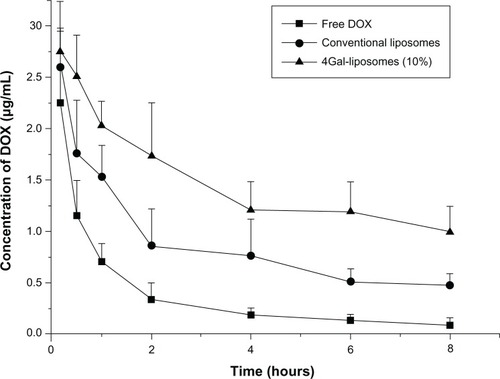
Table 2 DOX pharmacokinetics (mean ± SD) in plasma after intravenous injection of free DOX, conventional liposomes and 4Gal-liposomes (10%)
Figure 7 The fluorescence images of various organs of Kunming mice sacrificed at 1 hour (h), 3 hours, and 5 hours after injection with phosphate-buffered saline (A), free doxorubicin (B), conventional liposomes (C), four galactose-modified liposomes (5%) (D), and four galactose-modified liposomes (10%) (E) in vivo imaging system.
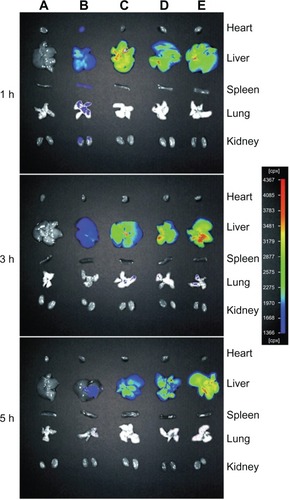
Figure 8 Confocal scanning microscopy images of liver sections of free doxorubicin (DOX) and DOX liposomes, blank (A), free DOX (B), conventional liposomes (C), four galactose-modified liposomes (5%) (D), and four galactose-modified liposomes (10%) (E). Nuclei were stained blue with 4′,6-diamidino-2-phenylindole, fluorescein isothiocyanate was shown as green fluorescence, DOX was shown as red fluorescence, and the merger image is on the bottom right.
Notes: Arrows with triangle head point to hepatocytes, and the others point to non-parenchymal cells.
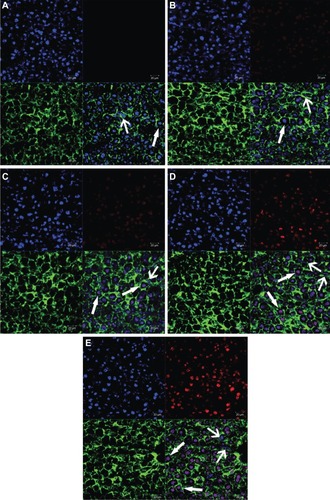
Figure S1 Proton nuclear magnetic resonance (400 MHz) spectrum of diethylenetriaminepentaacetic acid anhydride.
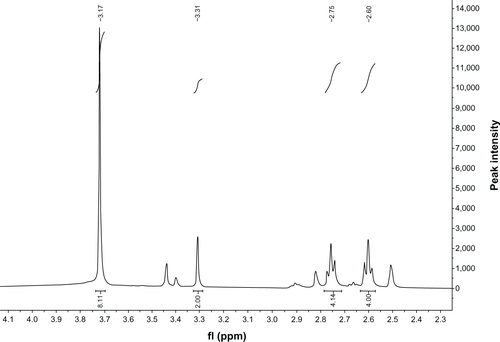
Figure S2 Proton nuclear magnetic resonance (400 MHz) spectrum of diethylenetriaminepentaacetic acid-distearoylphosphatidylethanolamine.
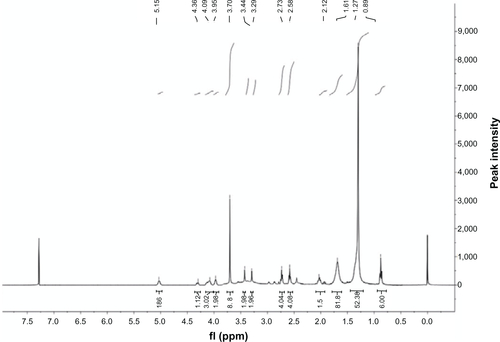
Figure S3 Proton nuclear magnetic resonance (400 MHz) spectrum of tetravalent galactosylated diethylenetriaminepentaacetic acid-distearoylphosphatidylethanolamine.
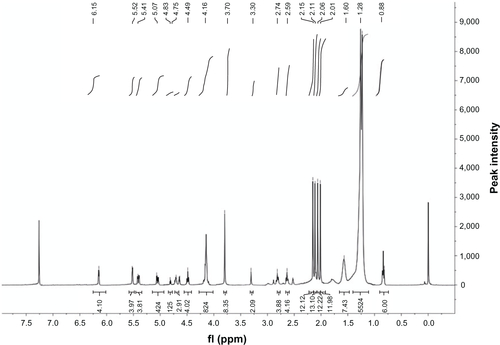
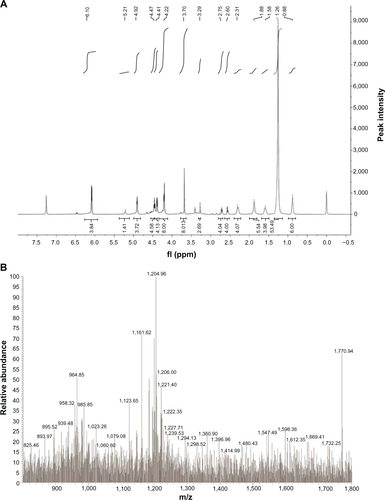
Figure S4 Proton nuclear magnetic resonance (400 MHz) spectrum (A) and mass spectrum (B) of galactosylated diethylenetriaminepentaacetic acid-distearoylphosphatidylethanolamine.