Figures & data
Figure 1 Average hydrodynamic diameter, zeta potential, and polydispersity index of SLN/protamine/DNA nanoparticles containing different amounts of SLNs to DNA (protamine/DNA, 1.5:1, w/w).
Abbreviations: SLN, solid lipid nanoparticles; DNA, deoxyribonucleic acid; ODA, octadecylamine.
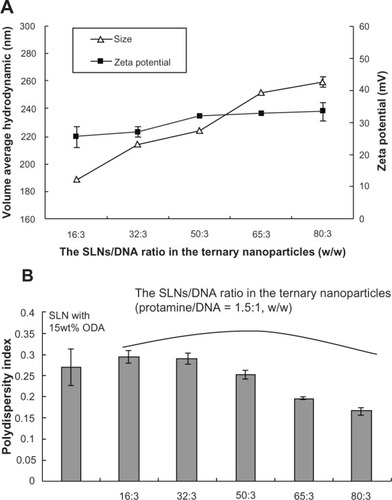
Figure 2 Atomic force microscopic images of (A) binary protamine/DNA nanoparticles (1.5:1, w/w), (B) SLN with 15 wt% ODA, (C) SLN/protamine/DNA nanoparticles (SLNs with 15 wt% ODA/protamine/DNA, 50:4.5:3, w/w/w), transmission electron microscopic images of (D) binary protamine/DNA nanoparticles, (E) SLNs with 15 wt% ODA (1.5:1, w/w), and (F) SLN/protamine/DNA nanoparticles (SLNs with 15 wt% ODA/protamine/DNA, 50:4.5:3, w/w/w).
Abbreviations: ODA, octadecylamine; SLNs, solid lipid particles; DNA, deoxyribonucleic acid.
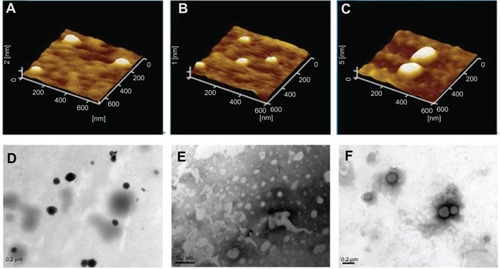
Figure 3 Gel retarding (A and B) and DNase I degradation assay (C) of protamine/DNA nanoparticles and SLN/protamine/DNA nanoparticles. In (B), lanes 3, 4, and 5 represent SLN/protamine/DNA nanoparticles prepared with SLNs containing 0 wt%, 10 wt%, or 15 wt% ODA (w/w/w, 3:0.5:1). (C) line A represents naked DNA as a control, line B represents SLN/DNA nanoparticles (SLNs with 15 wt% ODA/DNA, 50:3, w/w), line C represents binary protamine/DNA nanoparticles at a weight ratio of 1.5:1, line D represents SLN/protamine/DNA nanoparticles (SLNs with 15 wt% ODA/protamine/DNA, 50:4.5:3, w/w/w), and line E represents SLN/protamine/DNA nanoparticles (SLNs with 0 wt% ODA/protamine/DNA, 50:4.5:3, w/w/w).
Abbreviations: M, marker; DNA, deoxyribonucleic acid; ODA, octadecylamine; SLNs, solid lipid particles.
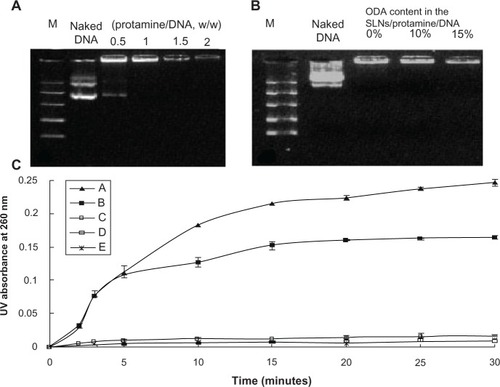
Figure 4 Effect of amounts of SLNs on gene transfection of SLN/protamine/DNA nanoparticles when the weight ratio of SLNs with 15 wt% ODA to DNA increases from 16:3 to 80:3 with a weight ratio of protamine to DNA of 1.5:1.
Abbreviations: ODA, octadecylamine; SLNs, solid lipid particles; DNA, deoxyribonucleic acid; RLU, relative luminescence units.
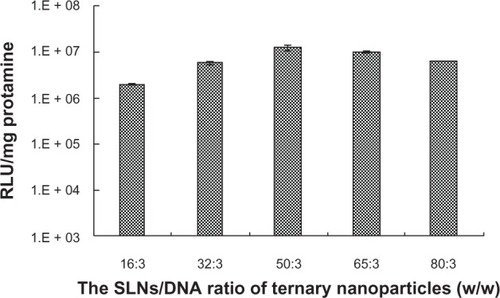
Figure 5 Fluorescent microscopy of heK293 cells transfected by pEGFP-N1. (A) Negative control (naked DNA only), (B) transfection with protamine/DNA nanoparticles for 72 hours, (C, E and G) cells transfected with Lipofectamine™ 2000/DNA for 24, 48, and 72 hours, respectively. (D, F and H) cells transfected with SLN/protamine/DNA nanoparticles (50 μg/mL SLNs containing 15 wt% ODA, 4.5 μg/mL protamine, 3.0 μg/ml DNA) for 24, 48, and 72 hours, respectively, (I) negative control, and (J–N) cells transfected with SLN/protamine/DNA nanoparticles containing 0 wt%, 5 wt%, 10 wt%, 15 wt%, and 20 wt% ODA, respectively (concentrations of all types of SLNs, 50 μg/mL with 4.5 μg/mL protamine and 3.0 μg/mL DNA).
Abbreviations: ODA, octadecylamine; SLNs, solid lipid particles; DNA, deoxyribonucleic acid.
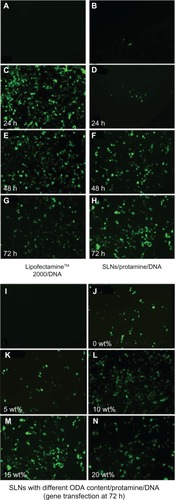
Figure 6 Effects of serum on transfection of lipofectamine™2000/DNA and SLN/protamine/DNA nanoparticles (SLNs with 15 wt% ODA/protamine/DNA, 50:4.5:3, w/w/w) using a luminescence assay. *P < 0.05 by t-test. Transfection time for Lipofectamine 2000/DNA and SLN/protamine/DNA nanoparticles was 24 and 72 hours, respectively.
Abbreviations: ODA, octadecylamine; RLU, relative light units; SLNs, solid lipid particles; DNA, deoxyribonucleic acid.
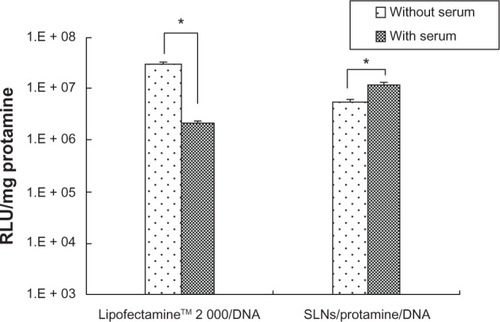
Figure 7 Cell viability by MTT test. (1) Negative control, (2) SLN/protamine/DNA nanoparticles (50 μg/mL SLNs containing 15 wt% ODA, 4.5 μg/mL protamine, 3.0 μg/mL DNA), (3) SLNs (50 μg/mL SLNs containing 0 wt% ODA, 4.5 μg/mL protamine, 3.0 μg/mL DNA), (4) Lipofectamine™ 2000/DNA nanoparticles (6 μg/mL Lipofectamine 2000, 3.0 μg/mL DNA), and (5) protamine/DNA binary nanoparticles (4.5 μg/mL protamine, 3.0 μg/mL DNA). *P < 0.05 comparing it with Lipofectamine.
Abbreviations: ODA, octadecylamine; SLNs, solid lipid particles; DNA, deoxyribonucleic acid.
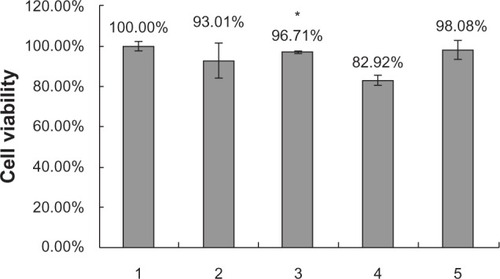
Figure 8 Fluorescent images after cells were incubated with fluorescent nanoparticles for 6 hours. The cells were treated with Hoechst 33342 (blue) to detect the nucleus and DNA was labeled by ROX (red).
Notes: (A) is naked DNA. (C) is the DNA of SLNs with 15% ODA/DNA. (E) is the DNA of Protamine/DNA. (G) is the DNA of SLNs with 0 wt ODA/protamine/DNA. (B, D, F, H, J) are the nucleus corresponding to the above group. (I) is the DNA of SLNs with 15% Wt DA/protamine/DNA. (K–O) are the merged images of DNA with nucleus.
Abbreviations: ODA, octadecylamine; SLNs, solid lipid particles; DNA, deoxyribonucleic acid.
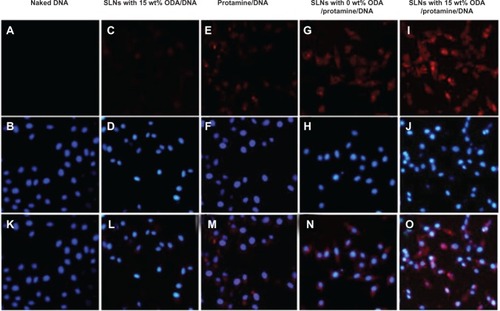
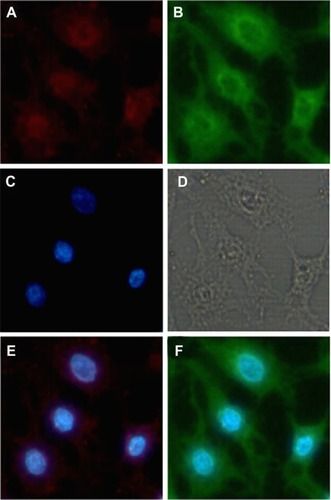
Figure 9 Fluorescent images of cells incubated with the fluorescent ternary nanoparticles for 6 hours. The cells were treated with Hoechst 33342 to detect the nucleus, SLNs were labeled with ODA-FITC (green), and DNA was labeled with ROX (red). (A) ROX-DNA, (B) ODA-FITC-loaded SLNs, (C) nucleus, (D) observed under transmitted light, (E) merged image of ROX-DNA and nucleus, and (F) merged image of ODA-FITC and nucleus.
Abbreviations: ODA, octadecylamine; FITC, fluorescein isothiocyanate; SLNs, solid lipid particles; DNA, deoxyribonucleic acid.