Figures & data
Figure 1 (A–I) Ultrastructure of keratinocytes treated with 5.8 nm platinum nanoparticles (PtNPs). (A–C) Keratinocytes from the control fixed after 24 hours (A) and 48 hours (B and C) of in vitro culturing. (D and E) Endosome/lysosome-like organelles in a keratinocyte treated for 24 hours with 12.5 μg/mL PtNPs. Electron-dense material of an NP aggregate is observed inside an endosome/lysosome. (F and G) Part of a keratinocyte exposed for 48 hours to 12.5 μg/mL and (G) 25 μg/mL PtNPs. (H) Endosomes/lysosomes in a keratinocyte treated with 25 μg/mL PtNPs and fixed after 24 hours. (I) Keratinocytes treated for 24 hours with 5.8 nm PtNPs or 57 nm PtNPs at the indicated concentrations. Arrows indicate groups of 57 nm PtNPs localized inside treated keratinocytes.
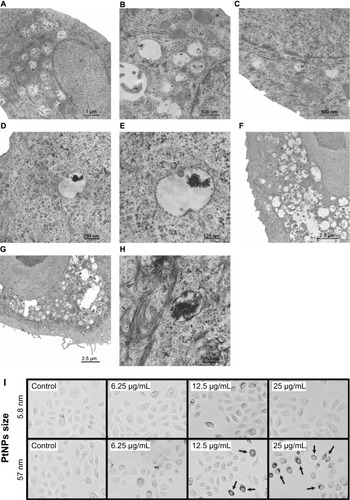
Figure 2 (A and B) Biological activity of cells treated with platinum nanoparticles (PtNPs). (A) An MTT (3-[4,5-dimethylthiazol-2-yl]-2,5-diphenyltetrazolium bromide) assay was carried out to measure cell viability. Normal human epidermal keratinocytes (NHEKs; plated at a density of 4 × 10³ per well of 96-well plates) were treated with PtNPs of two sizes (5.8 and 57 nm) in concentrations of 6.25, 12.5, and 25 μg/mL at indicated time points. Untreated cells served as a control. For statistics, Student’s t-test was performed. The graphs (left panel and right panel) represent the mean ± standard deviation (SD) of five independent experiments, each performed in quintuplicate (number of wells = 25). (B) An adenosine triphosphate assay was performed to determine metabolic activity of cells. NHEKs (plated as in (A)) were treated with PtNPs as described in (A). Untreated cells served as a control. For statistics, Student’s t-test was performed (*P < 0.05; **P < 0.01; ***P < 0.001). The graphs represent the mean ± SD of three independent experiments, each performed in triplicate (number of wells = 9).
Abbreviation: ATP, adenosine triphosphate.
![Figure 2 (A and B) Biological activity of cells treated with platinum nanoparticles (PtNPs). (A) An MTT (3-[4,5-dimethylthiazol-2-yl]-2,5-diphenyltetrazolium bromide) assay was carried out to measure cell viability. Normal human epidermal keratinocytes (NHEKs; plated at a density of 4 × 10³ per well of 96-well plates) were treated with PtNPs of two sizes (5.8 and 57 nm) in concentrations of 6.25, 12.5, and 25 μg/mL at indicated time points. Untreated cells served as a control. For statistics, Student’s t-test was performed. The graphs (left panel and right panel) represent the mean ± standard deviation (SD) of five independent experiments, each performed in quintuplicate (number of wells = 25). (B) An adenosine triphosphate assay was performed to determine metabolic activity of cells. NHEKs (plated as in (A)) were treated with PtNPs as described in (A). Untreated cells served as a control. For statistics, Student’s t-test was performed (*P < 0.05; **P < 0.01; ***P < 0.001). The graphs represent the mean ± SD of three independent experiments, each performed in triplicate (number of wells = 9).Abbreviation: ATP, adenosine triphosphate.](/cms/asset/fc146c71-3542-417f-b7d9-a6b76c5630f9/dijn_a_49612_f0002_b.jpg)
Figure 3 (A and B) Cell migration. Normal human epidermal keratinocytes seeded on six-well plates (4 × 10⁴ per well) were exposed to 5.8 (A) and 57 (B) nm platinum nanoparticles (PtNPs) in concentrations of 12.5 and 25 μg/mL for 24 hours and 48 hours. Cell migration was recorded for 90 minutes with 1.5-minute time lapse using a Leica DMI6000B microscope equipped with Leica Application Suite Advanced Fluorescence software. The tracks of individual cells were determined from the series of changes in the cell centroid positions, pooled, and analyzed to determine the total length of the cell trajectory (left panels). All analyses were performed using Hiro software version 1.0.0.4. Presented data are means ± standard deviation from cell-speed values for 150 cells, measured in three independent experiments. Student’s t-test was carried out for statistics (right panels).
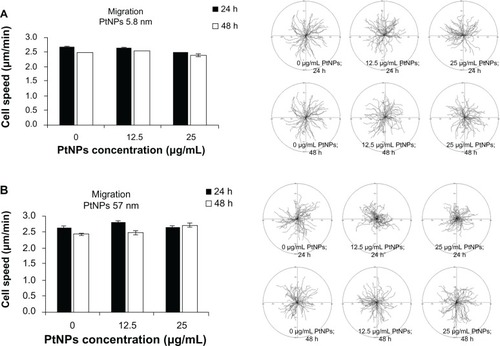
Figure 4 (A and B) Cell-cycle phases and DNA content in keratinocytes by flow cytometry following treatment with platinum nanoparticles (PtNPs). (A) Percentage content of cells in each cell-cycle phase (G0/G1, S, G2/M) as well as polyploid cells (>4 n) following 24- and 48-hour treatment with different doses of 5.8 and 57 nm PtNPs. The bars represent average data (means ± standard deviation [SD]). (B) Representative histograms showing DNA content of cells following treatment with PtNPs and stained with propidium iodide. The numbers represent the ratio of nondividing, quiescent, and proliferating cells (Q/P) in each sample, calculated as ratio between cells in G0/G1 phase to sum of S and G2/M phases. The numbers represent mean data ± SD.
Abbreviation: Ctrl, control.
![Figure 4 (A and B) Cell-cycle phases and DNA content in keratinocytes by flow cytometry following treatment with platinum nanoparticles (PtNPs). (A) Percentage content of cells in each cell-cycle phase (G0/G1, S, G2/M) as well as polyploid cells (>4 n) following 24- and 48-hour treatment with different doses of 5.8 and 57 nm PtNPs. The bars represent average data (means ± standard deviation [SD]). (B) Representative histograms showing DNA content of cells following treatment with PtNPs and stained with propidium iodide. The numbers represent the ratio of nondividing, quiescent, and proliferating cells (Q/P) in each sample, calculated as ratio between cells in G0/G1 phase to sum of S and G2/M phases. The numbers represent mean data ± SD.Abbreviation: Ctrl, control.](/cms/asset/88628668-bd2e-42e3-9239-53a8db842e75/dijn_a_49612_f0004_b.jpg)
Figure 5 (A–C) Determination of DNA quality and activation of caspases in platinum nanoparticle (PtNP)-treated normal human epidermal keratinocytes (NHEKs). (A and B) DNA damage in NHEKs was investigated by comet assay. Cells were plated at a density of 2.1 × 10³ cells/cm2. After 24 hours, NHEKs were treated with 12.5 and 25 μg/mL for 24 and 48 hours. Mean values of the percentage of DNA in the comet tail are presented. Images were made using the computer program Comet Plus (left panels). Statistical analyses were calculated using Tukey’s rank-invariant resampling test (*P < 0.05; **P < 0.01; ***P < 0.001). The data represent the means ± standard deviation (SD) from DNA damage in 100 cells, measured in three independent experiments (right panels). (C) Activation of caspases. The apoptotic effect triggered by PtNPs was measured by the determination of caspase 9 and 3/7 activity. A luminescent assay was performed using 3 μg protein isolated from NHEKs after incubation with 12.5 and 25 μg/mL PtNPs for 24 and 48 hours. The graph represents the means ± SD of three independent experiments. Student’s t-test was carried out for statistics (*P < 0.05; **P < 0.01; ***P < 0.001).
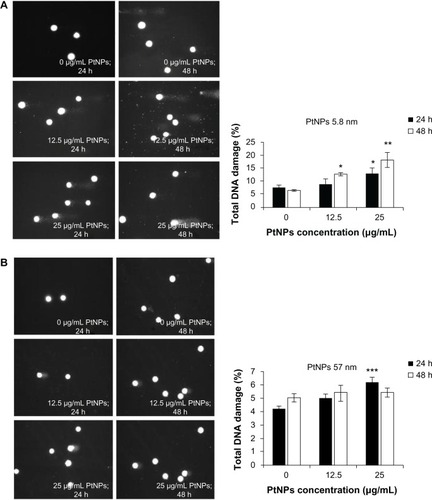
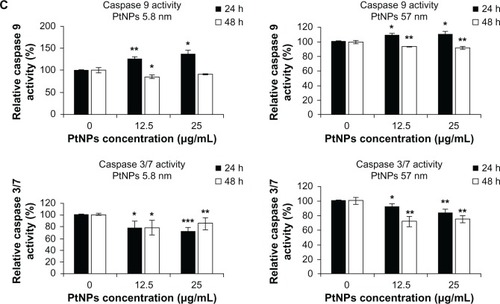
Figure 6 (A–D) Activation of ERK, Akt, p38, and JNK by Western blot analysis. Normal human epidermal keratinocyte cells were cultured in 60 mm tissue-culture dishes at a density of 9.5 × 10³ cells/cm2. The cells were exposed to 12.5 and 25 μg/mL PtNPs for 0.5, 4, and 24 hours. Untreated cells, harvested together at the 0.5-hour time point, served as a control. At the time of NP addition, the whole medium was exchanged in both treated and untreated cells. Tubulin was used as an internal control to monitor for equal loading. The data are representative of three independent experiments.
Abbreviations: PtNPs, platinum nanoparticles; p-ERK, phosphorylated extracellular signal-regulated kinase; p-Akt, phosphorylated protein kinase B; p-JNK, phosphorylated c-Jun N-terminal kinase; Akt, protein kinase B.
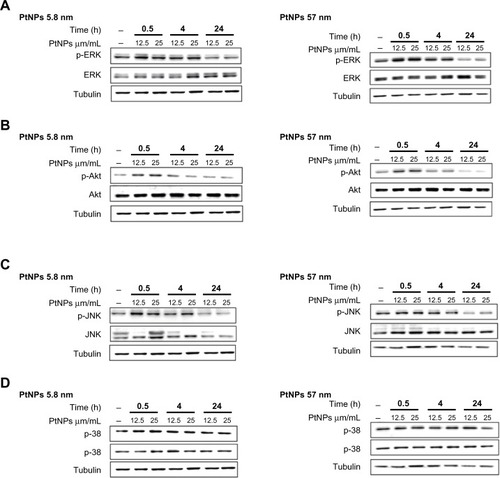
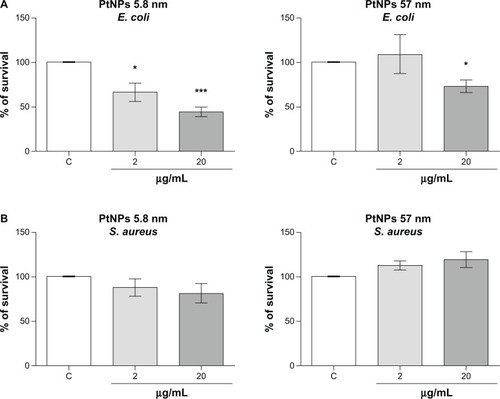
Figure 7 (A and B) Antibacterial activity of platinum nanoparticles (Pt-NPs). Concentration-dependent antibacterial effect of Pt-NPs on Escherichia coli (A) and Staphylococcus aureus (B). Antimicrobial activity was determined using a colony-reduction assay. Bacteria were incubated alone or with PtNPs at concentrations of 2–200 μg/mL for 2 hours at 37°C, then plated onto agar plates to determine the numbers of colony-forming units. Percentage survival was calculated and compared to bacteria grown without PtNPs (100% survival). Mean values ± standard error of mean of three independent experiments performed in triplicate are shown.
Notes: * P < 0.05; ***P < 0.001.
Abbreviations: E. coli, Escherichia coli; S. aureus, Staphylococcus aureus.