Figures & data
Figure 1 A schematic representation of cell response to the surrounding environmental changes.
Note: The figure illustrates how an aligned and elongated cell changes its morphology when the direction of surface patterns suddenly changes.
Abbreviation: Ttrans, transition temperature.
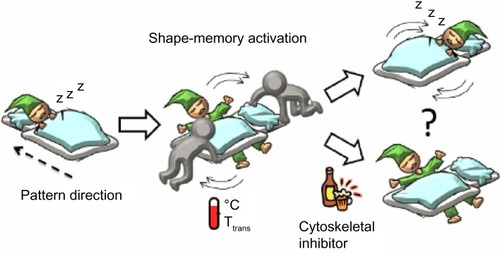
Figure 2 Shape-memory transition from a memorized temporal pattern (left) to the original permanent pattern (right).
Notes: (A) macroscopic; (B and C) SEM (bar = 1 mm); and (D) AFM images of PCL films before and after shape-memory transition.
Abbreviations: SEM, scanning electron microscope; AFM, atomic force microscopy; PCL, poly(ε-caprolactone).
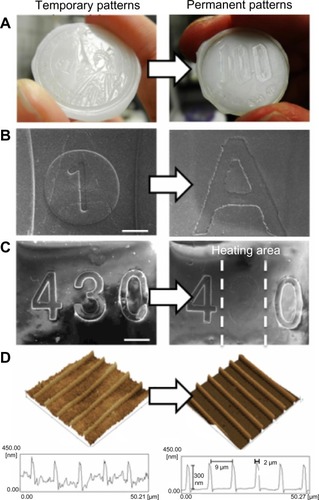
Figure 3 Contact angles on PCL surface at 25°C and 37°C.
Abbreviation: PCL, poly(ε-caprolactone).
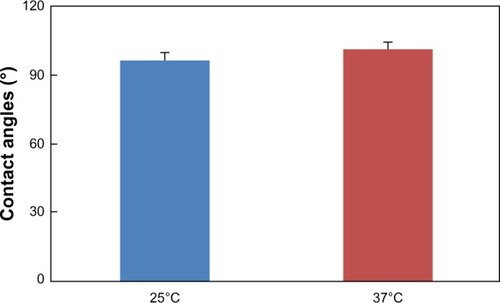
Figure 4 Phase contrast images of NIH 3T3 fibroblasts seeded on the fibronectin-coated PCL.
Notes: (A) Phase contrast images of NIH 3T3 fibroblasts seeded on the fibronectin-coated PCL films with the temporal grooved surface (cells were cultured at 32°C for 24 hours). (B) For the surface shape-memory experiment, the cells were subjected to a 37°C heat treatment for 1 hour. (C) The cells were then allowed to equilibrate at 32°C for 48 hours.
Abbreviation: PCL, poly(ε-caprolactone).
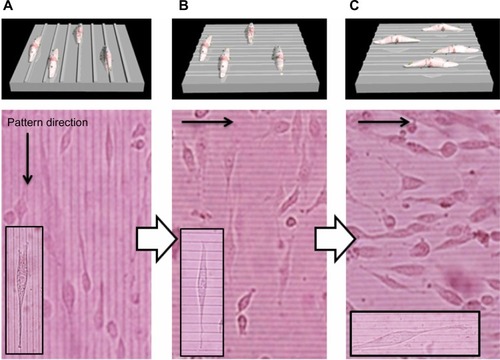
Figure 5 Histograms of cell orientation angle on the PCL film before and after shape-memory activation. Cell orientation angles were quantified by the analysis of phase contrast images and defined as the angle against the temporary groove direction.
Abbreviations: h, hours; PCL, poly(ε-caprolactone).
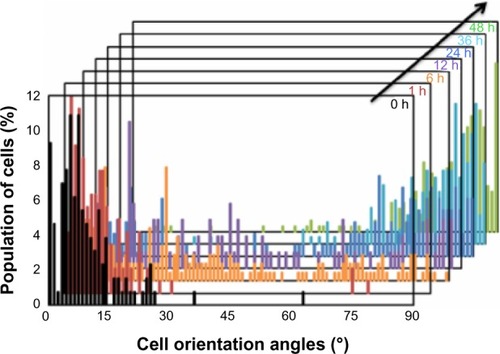
Figure 6 Time-dependent changes in the orientation angles and elongation ratio of cells on the PCL film after shape-memory transition from a temporal grooved pattern to the permanent grooved patterns which is perpendicular to the original shape (A), from a temporal grooved pattern to the permanent flat surface (B), and from a temporal fat surface to the permanent grooved pattern (C). Cell orientation angles were quantified by the analysis of phase contrast images and defined vertical direction to elongation as a 0°. Cell elongations were calculated from the length ratio of Y axis (elongation direction) and X axis (perpendicular direction against elongation).
Abbreviations: h, hours; PCL, poly(ε-caprolactone).
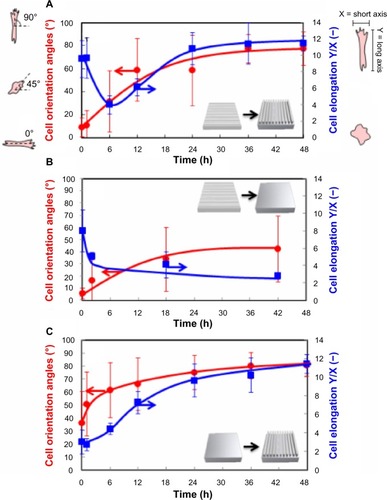
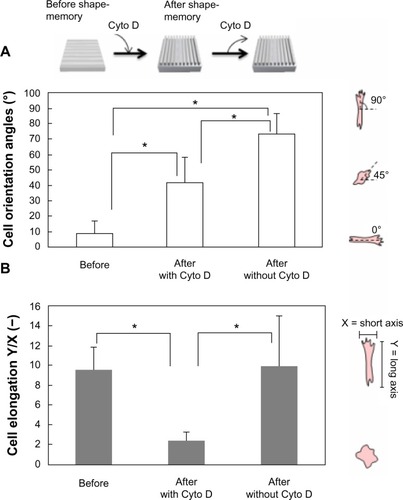
Figure 7 Cell orientation angles (A) and elongation ratio (B) on the PCL film before and after shape-memory transition from a temporal grooved pattern to the permanent grooved patterns which is perpendicular to the original shape. Cells were cultured at 32°C for 24 hours (left image in A). The cells were subjected to a 37°C heat treatment for 1 hour in the presence of cytochalasin D and allowed to equilibrate at 32°C for 24 hours (middle image in A). The culture medium was then exchanged to remove cytochalasin D from the medium and cells were cultured for another 24 hours (right image in A).