Figures & data
Figure 1 Pseudoternary phase diagrams plotted with castor oil, Transcutol HP/Tween 80 (1:1, volume ratio), and water.
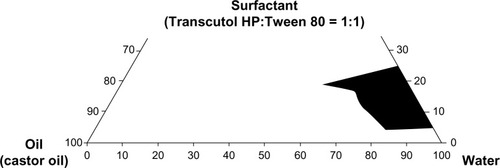
Figure 2 Effect of agitator speed (A), feed pressure (B), and continuous phase temperature (C) on the z-average diameter of the emulsion droplet. Each value represents the mean ± standard deviation (n = 3).
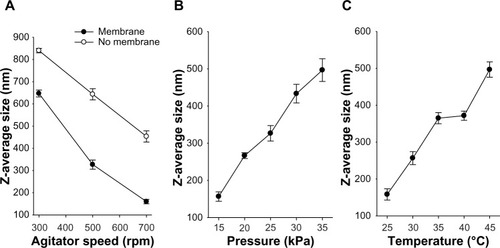
Figure 3 Scanning electron micrographs for (A) silymarin powder (1,000×), (B), silymarin powder (5,000×), (C) nanoparticles (1,000×), and (D) nanoparticles (5,000×).
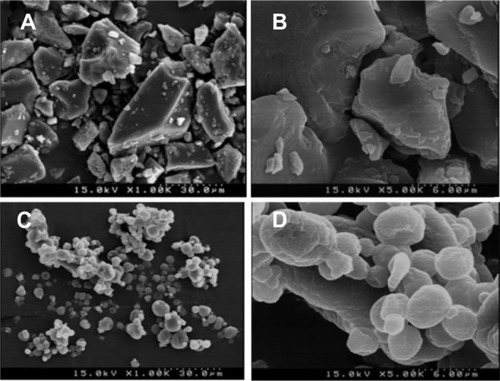
Figure 4 Differential scanning calorimetric thermograms (A) and powder X-ray diffraction (B). (A1 and B1), polyvinylpyrrolidone, (A2 and B2), silymarin powder, (C1 and C2), physical mixture, and (D1 and D2), nanoparticles.
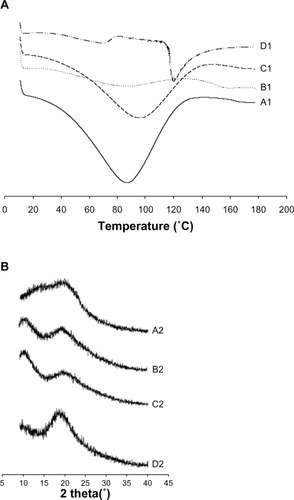
Figure 5 Dissolution profile of the drug from commercial product and nanoparticles in water. Each value represents the mean ± standard deviation (n = 6).
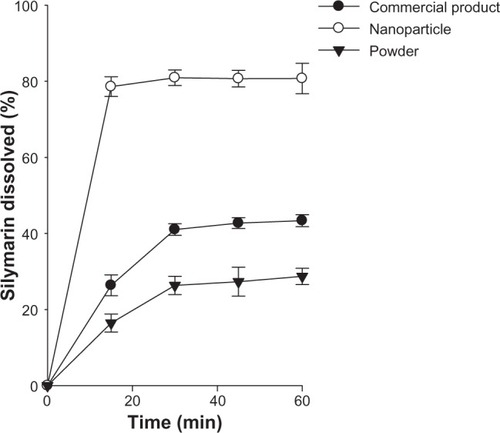
Figure 6 Plasma concentration-time profiles for the drug after oral administration of commercial product and nanoparticles in rats. Each value represents the mean ± standard deviation (n = 6). *P < 0.05 compared with commercial product.
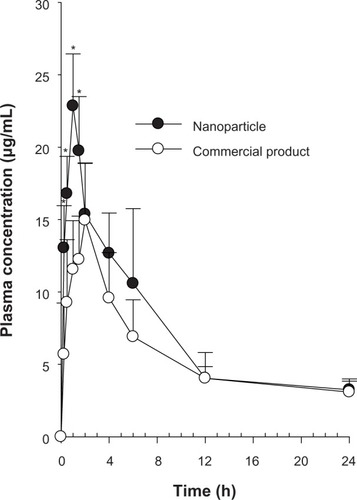
Table 1 Pharmacokinetic parameters
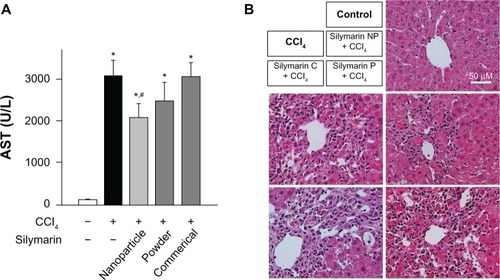
Figure 7 Effect of silymarin-loaded solid nanoparticles on carbon tetrachloride-induced hepatotoxicity. (A) Serum activity of aspartate aminotransferase; each value represents the mean ± standard deviation. (n = 5) and was analyzed by the student’s t-test. *P < 0.05 compared with control group; #P < 0.05 compared with treated group. (B) Representative photos of hematoxylin-eosin staining of liver sections.
Abbreviations: AST, aspartate aminotransferase; NP, nanoparticles; silymarin C, commercial product of silymarin; silymarin P, silymarin powder; CCl4, carbon tetrachloride.