Figures & data
Table 1 Formulations and droplet sizes of microemulsions and puerarin content
Figure 1 Pseudo ternary phase diagrams composed of (A) O/W-ME: Cremophor RH40 and propylene glycol as surfactant and co-surfactant (2:1, w/w), (B) W/O-ME: lecithin and ethanol as surfactant and co-surfactant (1:1, w/w), while ethyl oleate was used as the oil phase. The grey area represents the ME existence range.
Abbreviations: Co-S, co-surfactant; ME, microemulsion; O, oil; S, surfactant; W, water; w, weight.
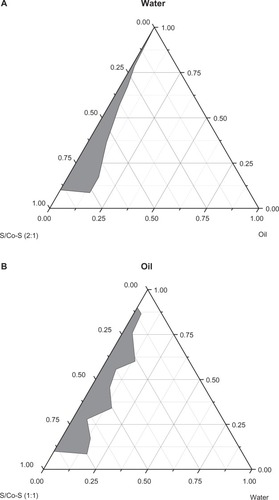
Figure 2 Transmission electron microscopy analysis of microemulsions: (A) O/W-ME and (B) W/O-ME.
Note: Scale bar: 100 nm.
Abbreviations: Me, microemulsion; O, oil; W, water.
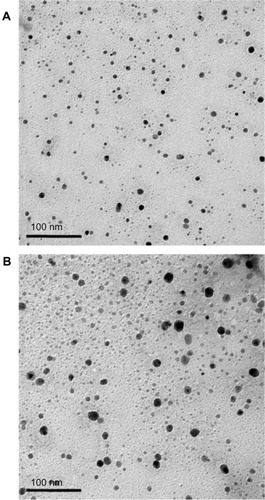
Figure 3 The Ka obtained for in situ perfusion in the SPIP model for four different intestinal segments. The data are presented as the mean ± SD (n=6).
Abbreviations: Ka, absorption rate constant; ME, microemulsion; min, minute; O, oil; SD, standard deviation; SPIP, single-pass intestinal perfusion; W, water.
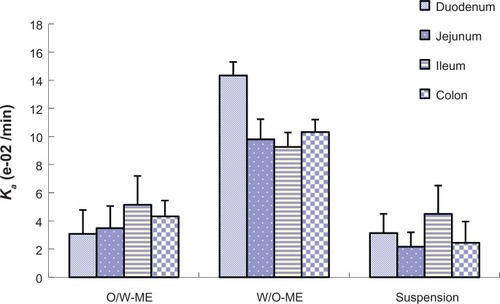
Figure 4 The Papp obtained for in situ perfusion in the SPIP model for four different intestinal segments. The data are presented as the mean ± SD (n=6).
Abbreviations: Papp, apparent permeability coefficients; ME, microemulsion; min, minute; O, oil; SD, standard deviation; SPIP, single-pass intestinal perfusion; W, water.
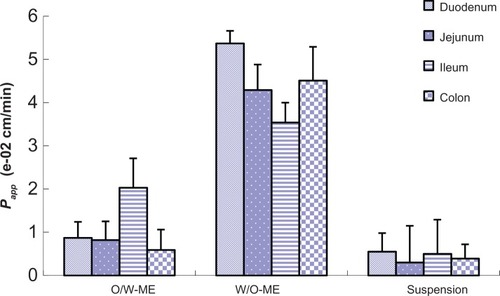
Figure 5 The Ka obtained for in situ perfusion in the SPIP model for the suspension, O/W-ME and W/O-ME. The data are presented as the mean ± SD (n=6).
Abbreviations: Ka, absorption rate constant; ME, microemulsion; min, minute; O, oil; SD, standard deviation; SPIP, single-pass intestinal perfusion; W, water.
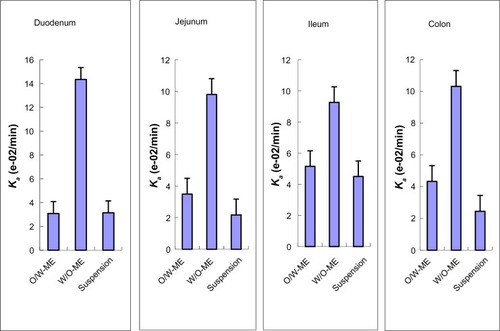
Figure 6 The Papp obtained for in situ perfusion in the SPIP model for the suspension, O/W-ME and W/O-ME. The data are presented as the mean ± SD (n=6).
Abbreviations: Papp, apparent permeability coefficients; ME, microemulsion; min, minute; O, oil; SD, standard deviation; SPIP, single-pass intestinal perfusion; W, water.
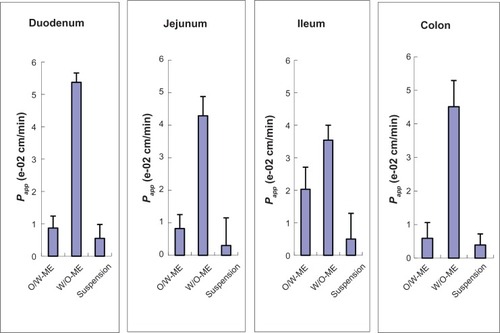
Table 2 Pharmacokinetic parameters obtained following the oral administration of puerarin microemulsions and a puerarin suspension in a single dose of 100 mg/kg to cycloheximide- and saline-treated rats (n=6, mean ± standard deviation)
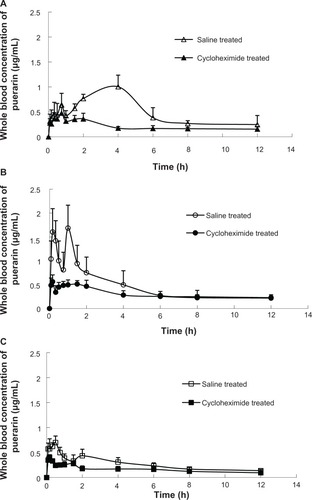
Figure 7 The whole blood concentration versus time profiles of puerarin after intragastric administration in the form of (A) an O/W-ME, (B) a W/O-ME, and (C) a suspension at a dose of 100 mg/kg to cycloheximide- and saline-treated rats (n=6).
Abbreviations: h, hours; ME, microemulsion; O, oil; W, water.