Figures & data
Figure 1 Illustration of fabrication of mixed shell micelles.
Abbreviation: PEG, polyethylene glycol.
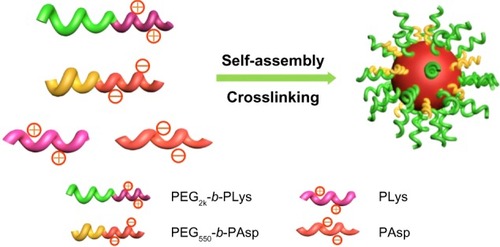
Table 1 Characteristics of micelles with various PEG2k/PEG550 ratios
Figure 2 (A) Hydrodynamic diameter (Dh) distribution of different micelles (PEG-0, PEG-25, PEG-50, and PEG-75) in 100 mM phosphate buffer (pH 7.4) determined by dynamic light scattering. (B) Representative TEM image of PEG-25 at 37°C. The scale bar is 200 nm. The TEM images of PEG-0, PEG-50, and PEG-75 are shown in .
Abbreviations: PEG, polyethylene glycol; TEM, transmission electron microscopy.
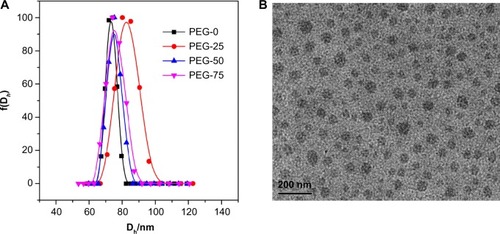
Table 2 Characterization of iodine-125-labeled micelles
Figure 3 Representative thin-layer chromatograms of iodine-125-labeled micelles (PEG-25) (A) before and (B) after purification.
Abbreviation: PEG, polyethylene glycol. Green bars indicate the location of detected radioactive peaks.
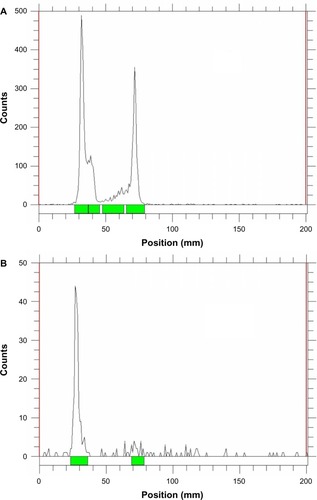
Figure 4 Cell viability of the micelles (PEG-0, PEG-25, PEG-50, and PEG-75) with (A) NIH-3T3 and (B) HepG2 cells measured by MTT assay.
Abbreviations: PEG, polyethylene glycol; MTT, 3-(4,5-dimethylthiazol-2-yl)-2,5-diphenyl tetrazolium bromide; NIH-3T3, mouse embryonic fibroblast cell line; HepG2, human liver hepa tocellular carcinoma cell line.
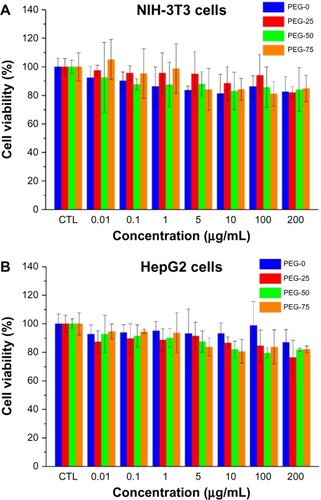
Figure 5 The size variation of the micelles (PEG-75) in the absence of serum (10 mM phosphate buffer, pH7.4 at 1, 5, and 10 hours) (A) and incubated with serum at the time period of 5 hours (B) and 10 hours (C) determined by dynamic light scattering at 37°C. The other three kinds of micelles are shown in .
Abbreviations: PEG, polyethylene glycol; f(Dh), the hydrodynamic diameter.
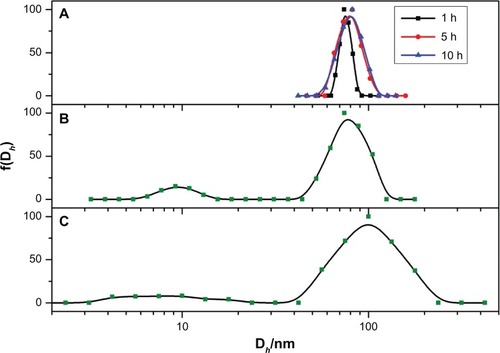
Figure 6 Protein adsorption efficiency of various micelles with mixed PEG shell on the surface. One-way analysis of variance was utilized for the statistical analysis. All statistical tests were two-sided.
Notes: *P<0.05, **P<0.01 compared with PEG-0; n=3.
Abbreviation: PEG, polyethylene glycol.
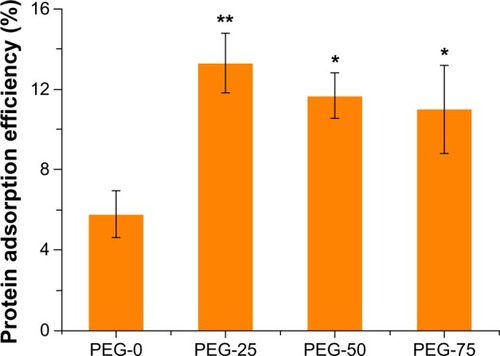
Figure 7 Inverted fluorescent microscopy presenting cellular uptake of micelles in RAW 264.7 murine macrophages after 4 hours of incubation with FITC-labeled micelles: (A) PEG-0, (B) PEG-25, (C) PEG-50, and (D) PEG-75 in medium with 10% FBS.
Abbreviations: FBC, fetal bovine serum; FITC, fluorescein isothiocyanate; PEG, polyethylene glycol; RAW 264.7, mouse macrophage-like cell line.
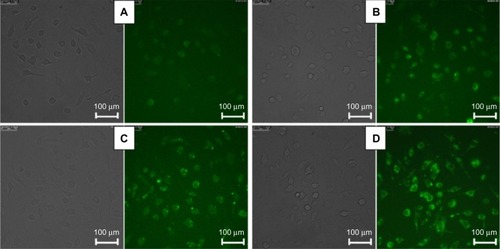
Figure 8 In vivo biodistribution of different micelles at various time points (1, 4, 8, 24, 48 hours) after injection with (A) PEG-0, (B) PEG-25, (C) PEG-50, and (D) PEG-75, respectively.
Notes: 5 mg micelles/kg mice body weight; data are expressed as %ID/g ± standard deviation; n=3.
Abbreviations: %ID/g, percent injected dose per gram; PEG, polyethylene glycol.
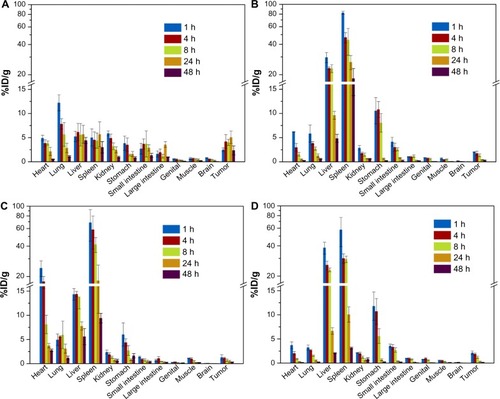
Figure 9 Representative Gamma camera images of the BALB/c mice. (A) PEG-0, (B) PEG-25, (C) PEG-50, and (D) PEG-75 at 4 hours after intravenous administration. (The y axis means the relative radioactive intensity).
Abbreviation: PEG, polyethylene glycol.
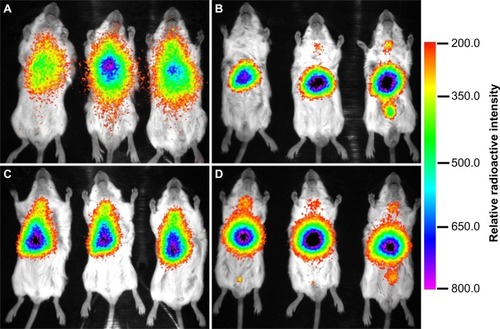
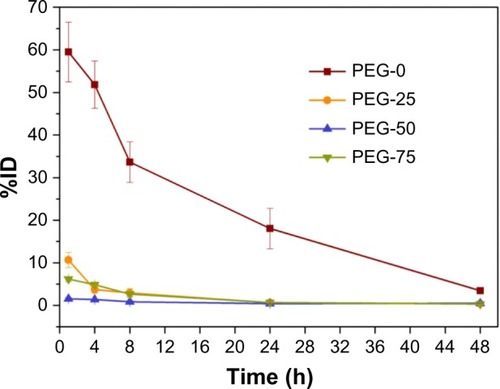
Figure 10 Blood clearance curves of micelles after intravenous administration.
Notes: Data are expressed as percent injected dose (%ID) ± standard deviation; n=3.
Scheme S1 Synthesis of (A) PAsp42, (B) PLys18, (C) PEG45-b-PLys32, (D) PEG-b-PAsp (PEG45-b-PAsp36 and PEG12-b-PAsp16), (E) PEG45-b-P(Lys31.7-co-LysTyr0.3) and (F) PEG45-b-P(Lys24-co-LysFITC8).
Abbreviations: PEG, polyethylene glycol; PLys, poly(L-lysine); PAsp, poly(aspartic acid); FITC, fluorescein isothiocyanate; EDC, 1-Ethyl-3-(3-dimethylaminopropyl) carbodiimide; NHS, N-hydroxysuccinimide; DMSO, dimethyl sulfoxide; DMF, N,N-Dimethylformamide; TFA, trifluoroacetic acid; Tyr, tyrosine.
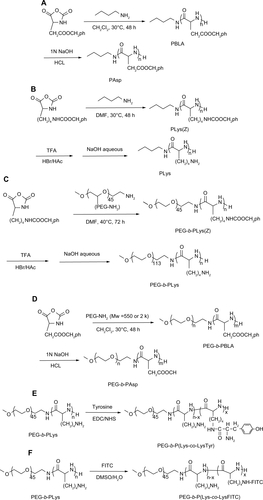
Figure S1 1H NMR spectra of (A) PAsp42, (B) PLys18, (C) PEG45-b-PLys32, (D) PEG45-b-PAsp36, and (E) PEG12-b-PAsp16 in D2O.
Abbreviations: NMR, nuclear magnetic resonance; PEG, polyethylene glycol; PLys, poly(L-lysine); PAsp, poly(aspartic acid).
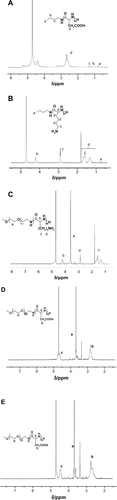
Figure S2 1H NMR spectra of (A) PEG45-b-P(Lys31.7-co-LysTyr0.3) and (B) PEG45-b-P(Lys24-co-LysFITC8) in D2O.
Abbreviations: NMR, nuclear magnetic resonance; PEG, polyethylene glycol; PLys, poly(L-lysine); PAsp, poly(aspartic acid); FITC, fluorescein isothiocyanate; Tyr, tyrosine.
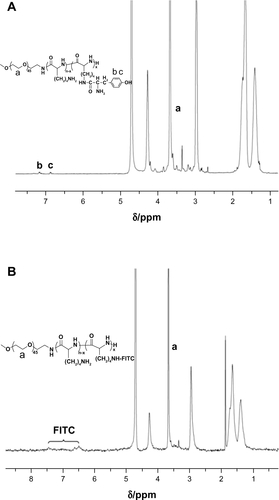
Figure S3 TEM images of micelles in the absence (left) and presence (right) of serum (stained with uranyl acetate) at 37°C (scale bar: 0.2 μm).
Abbreviation: TEM, transmission electron microscopy.
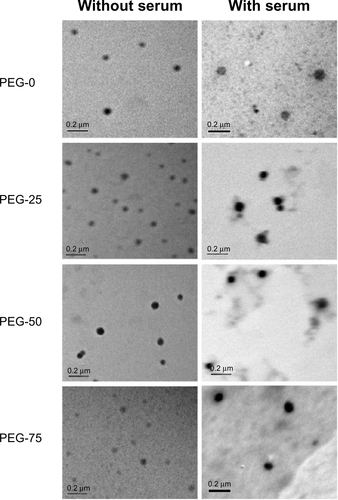
Figure S4 Thin-layer chromatograms of iodine-125-labeled micelles (A) before and (B) after purification. Green bars indicate the location of detected radioactive peaks.
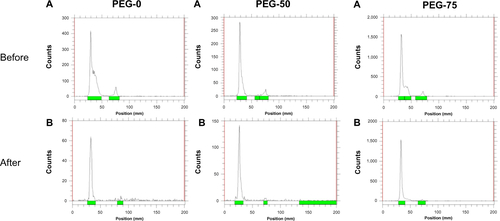
Figure S5 Size distributions of (A) PEG-0, (B) PEG-25, (C) PEG-50, and (D) PEG-75 in phosphate buffer (pH 7.4, 10 mM) at 37°C (a) without serum (1, 5, and 10 hours), and in the presence of serum at different time points, (b) 5 hours and (c) 10 hours.
Abbreviation: PEG, polyethylene glycol; Dh, hydrodynamic diameter.
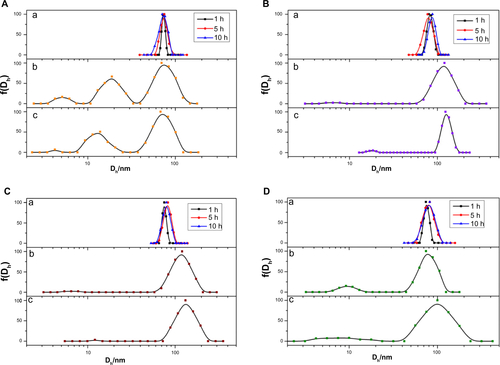
Table S1 Formulation of mixed shell micellesTable Footnotea