Figures & data
Table 1 Conductivity of the PVA/COS solutions
Figure 1 (A) Scanning electron micrographs of (a1) the neat PVA/COS nanofiber, (a2) the PVA/COS/3% AgNO3 nanofiber, and (a3) the PVA/COS-AgNP nanofiber. (B) Diameter distribution of (b1) the neat PVA/COS nanofiber, (b2) the PVA/COS/3% AgNO3 nanofiber and (b3) the PVA/COS-AgNPs nanofiber. (C) Field emission transmission electron micrographs of (c1) the non-UV-treated PVA/COS/3% AgNO3 nanofiber (c2) the post-UV-treated PVA/COS/3% AgNO3 nanofiber, and (c3) the PVA/COS-AgNP nanofiber.
Abbreviations: AgNP, silver nanoparticle; COS, chitosan oligosaccharide; PVA, poly(vinyl alcohol); UV, ultraviolet; Std dev, standard deviation.
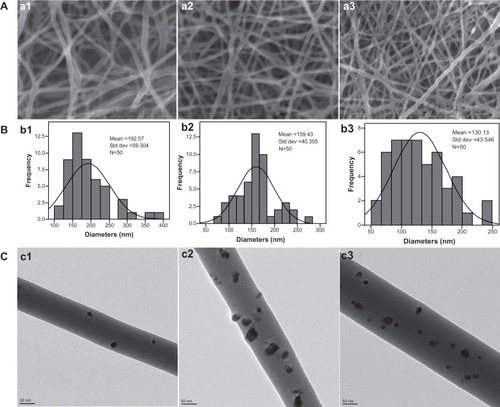
Figure 2 Ultraviolet-visible spectra for the nanofiber aqueous solutions. (A) The neat PVA/COS nanofiber, (B) the non-ultraviolet-treated PVA/COS/AgNO3 nanofiber, (C) the PVA/COS/AgNO3 nanofiber, (D) the PVA/COS-AgNP nanofiber, and (E) COS-AgNPs.
Abbreviations: AgNP, silver nanoparticle; COS, chitosan oligosaccharide; PVA, poly(vinyl alcohol); AU, absorbance units.
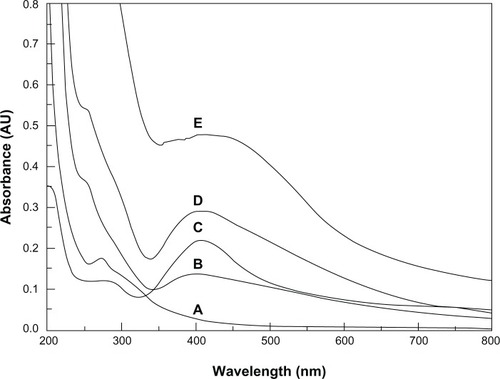
Figure 3 X-ray diffraction curves for (A) the PVA/COS/AgNO3 nanofiber and (B) the PVA/COS-AgNP nanofiber.
Abbreviations: AgNP, silver nanoparticle; COS, chitosan oligosaccharide; PVA, poly(vinyl alcohol).
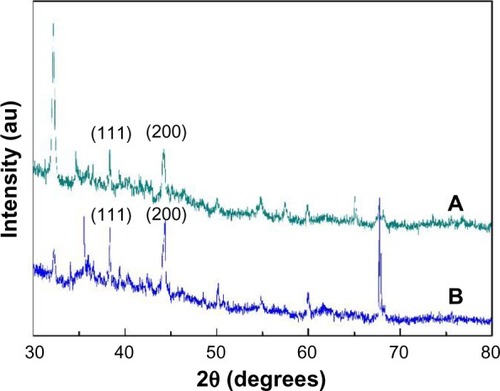
Figure 4 Fourier transform infrared spectra of (A) the neat PVA/COS nanofiber, (B) the PVA/COS/AgNO3 nanofiber, and (C) the PVA/COS-AgNP nanofiber.
Abbreviations: AgNP, silver nanoparticle; COS, chitosan oligosaccharide; PVA, poly(vinyl alcohol).
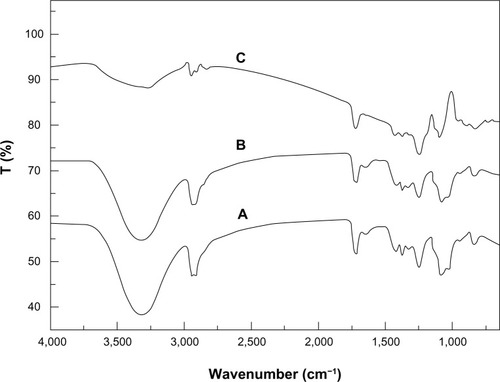
Figure 5 Differential scanning calorimetric thermograms for the (A) PVA nanofiber, (B) the neat PVA/COS nanofiber, (C) the PVA/COS/AgNO3 nanofiber, and (D) the PVA/COS-AgNP nanofiber.
Abbreviations: AgNP, silver nanoparticle; COS, chitosan oligosaccharide; PVA, poly(vinyl alcohol); au, arbitrary units.
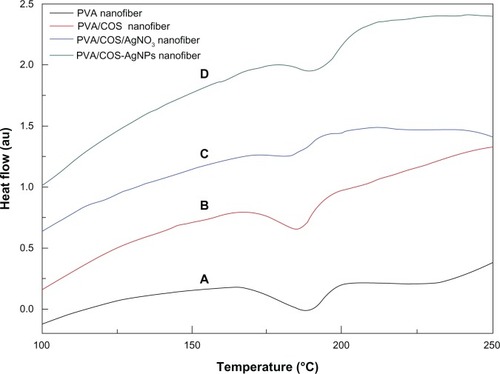
Figure 6 Water vapor permeability of (A) the PVA/COS nanofibers with a volume ratio of 2:1 cross-linked by glutaraldehyde vapor at various intervals and (B) the neat and drug-loaded nanofibers.
Abbreviations: AgNP, silver nanoparticle; COS, chitosan oligosaccharide; PVA, poly(vinyl alcohol).
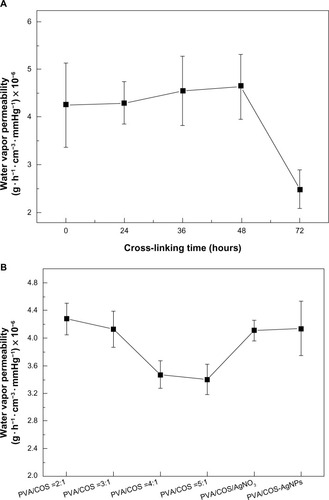
Figure 7 Degree of swelling and weight loss from (A) the PVA/COS nanofibers with a volume ratio of 2:1 cross-linked with glutaraldehyde vapor at various intervals and (B) the neat and drug-loaded nanofibers.
Abbreviations: AgNP, silver nanoparticle; COS, chitosan oligosaccharide; PVA, poly(vinyl alcohol).
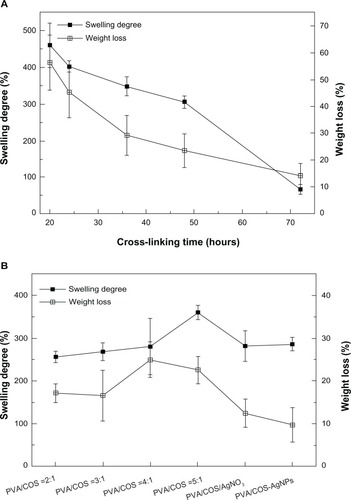
Figure 8 In vitro Ag release profiles from the PVA/COS-AgNP nanofiber and the PVA/COS/AgNO3 nanofiber.
Abbreviations: AgNP, silver nanoparticle; COS, chitosan oligosaccharide; PVA, poly(vinyl alcohol).
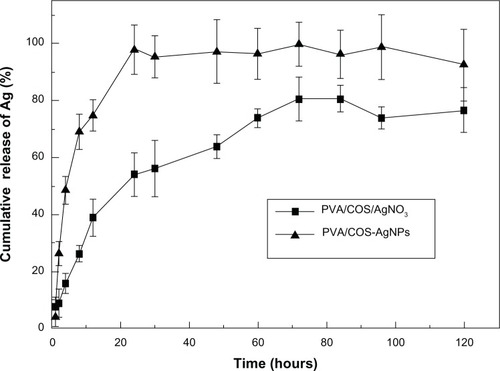
Figure 9 Cytotoxicity tests from the MTT assays of cell viability. Absorbance was normalized to that of the negative control at each time interval, and was considered 100%.
Notes: *P<0.05 compared with the negative control. The data are presented as the mean ± standard deviation (n=5).
Abbreviations: AgNP, silver nanoparticle; COS, chitosan oligosaccharide; PVA, poly(vinyl alcohol).
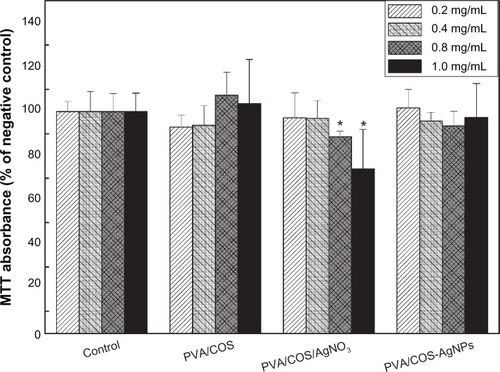
Table 2 Average primary skin irritation index values for single application (n=4)
Table 3 Average primary skin irritation index values for multiple applications (n=4)
Figure 10 Zone of inhibition test for (A and D) the neat PVA/COS nanofiber (B and E) the PVA/COS/AgNO3 nanofiber, and (C and F) the PVA/COS-AgNP nanofiber. Also shown are photographs of the disk sensitivity test for Staphylococcus aureus (A–C) and Escherichia coli (D–F).
Abbreviations: AgNP, silver nanoparticle; COS, chitosan oligosaccharide; PVA, poly(vinyl alcohol).
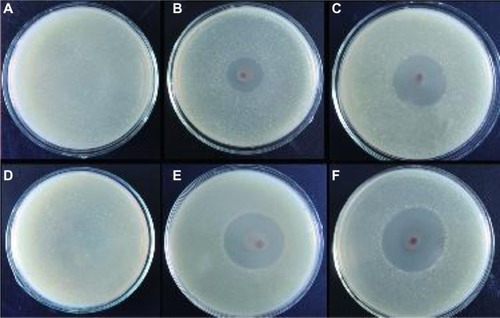
Figure 11 Bactericidal kinetic study against Staphylococcus aureus (A) and Escherichia coli (B) for the different nanofibers.
Abbreviations: AgNP, silver nanoparticle; COS, chitosan oligosaccharide; PVA, poly(vinyl alcohol); UV, ultraviolet.
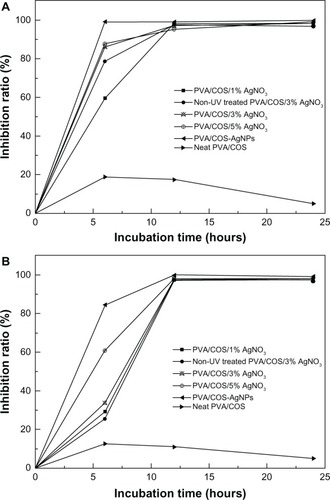
Figure 12 Wound appearance at 1, 7 and 14 days after grafting with (A) gauze, (B) the PVA/COS/AgNO3 nanofiber, (C) the PVA/COS-AgNP nanofiber, and (D) the commercial woundplast.
Abbreviations: AgNP, silver nanoparticle; COS, chitosan oligosaccharide; PVA, poly(vinyl alcohol).
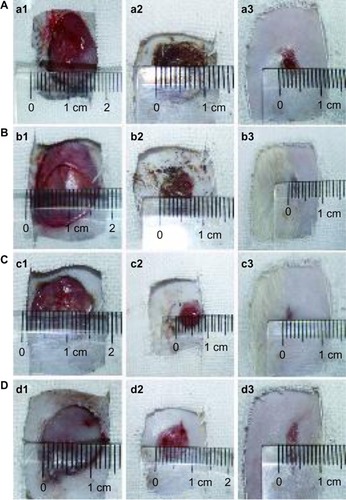
Figure 13 Wound healing with the PVA/COS/AgNO3 nanofiber, the PVA/COS-AgNP nanofiber, commercial woundplast, and gauze.
Notes: *P<0.05 compared with the gauze. The data are presented as the mean ± standard deviation (n=6).
Abbreviations: AgNP, silver nanoparticle; COS, chitosan oligosaccharide; PVA, poly(vinyl alcohol).
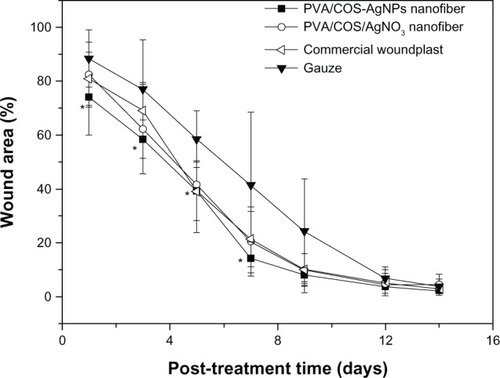
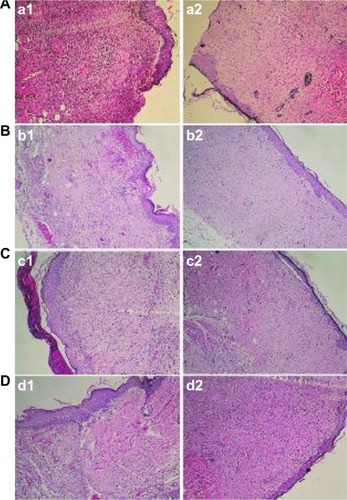
Figure 14 Histological examination after wounds had been covered for 7 and 14 days with (A) gauze, (B) the PVA/COS/AgNO3 nanofiber, (C) the PVA/COS-AgNP nanofiber, and (D) the commercial woundplast.
Abbreviations: AgNP, silver nanoparticle; COS, chitosan oligosaccharide; PVA, poly(vinyl alcohol).