Figures & data
Figure 1 Synthesis of silver nanoparticles (AgNPs) using Ganoderma neo-japonicum extract. The photo shows containers with samples of AgNO3 (1), G. neo-japonicum mycelia extract (2), AgNO3 with the G. neo-japonicum mycelia extract (3). after exposure for 24 hours the color of the solution turned from colorless to brown, indicating the formation of AgNPs.
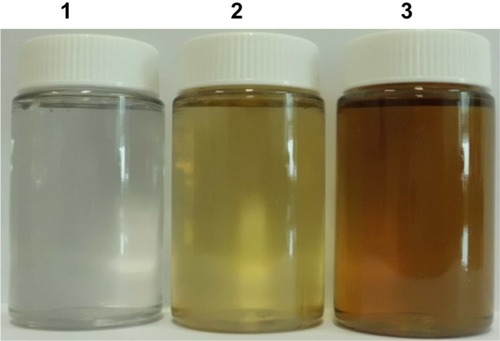
Figure 2 The ultraviolet-visible spectra of silver nanoparticles (AgNPs). The absorption spectra of AgNPs exhibited a strong broad peak at 420 nm, and observation of this band was attributed to surface plasmon resonance of the particles.
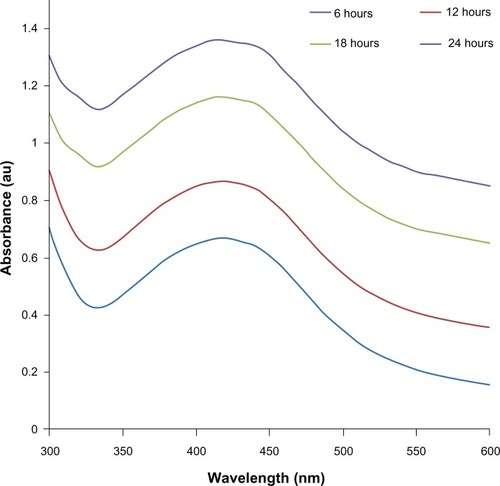
Figure 3 X-ray diffraction pattern of the silver nanoparticles (AgNPs) derived from Ganoderma neo-japonicum mycelial extract. The diffractions at 38.28° and 44.38° 2θ can be indexed to the (111) and (200) planes of the face-centered cubic AgNPs, respectively.
Note: The stars indicate the nonspecific peaks due to biomass residues.
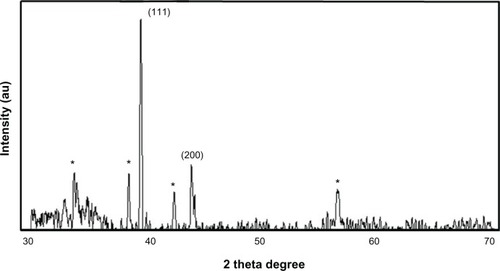
Figure 4 Size-distribution analysis by dynamic light scattering. The particle size-distribution analysis revealed that particle size was about 5 nm.
Abbreviations: dnm, diameter; PDI, polydispersity index.
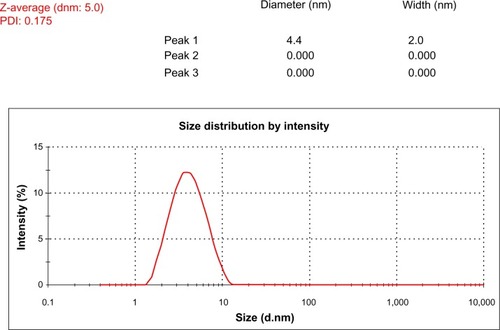
Figure 5 Size and morphology of silver nanoparticle (AgNP) analysis by transmission electron microscopy (TEM).
Notes: Several fields were photographed and used to determine the diameter of the NPs. Representative TEM image of AgNPs produced by Ganoderma neo-japonicum mycelial extract. The maximum size of the observed diameter was 5 nm.
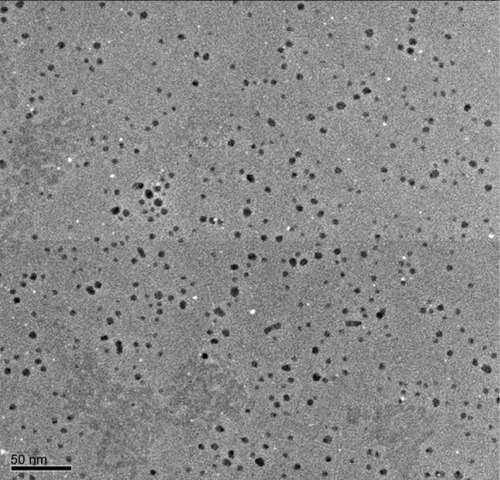
Figure 6 Cytotoxic effect of silver nanoparticles (AgNPs) on MDA-MB-231 human breast cancer cells. Cells were treated with AgNPs at various concentrations for 24 hours, and cytotoxicity was determined by the MTT (3-[4,5-dimethylthiazol-2-yl]-2,5-diphenyltetrazolium bromide) method.
Notes: The results represent the means of three separate experiments, and error bars represent the standard error of the mean. Treated groups showed statistically significant differences from the control group with Student’s t-test (P<0.05).
![Figure 6 Cytotoxic effect of silver nanoparticles (AgNPs) on MDA-MB-231 human breast cancer cells. Cells were treated with AgNPs at various concentrations for 24 hours, and cytotoxicity was determined by the MTT (3-[4,5-dimethylthiazol-2-yl]-2,5-diphenyltetrazolium bromide) method.Notes: The results represent the means of three separate experiments, and error bars represent the standard error of the mean. Treated groups showed statistically significant differences from the control group with Student’s t-test (P<0.05).](/cms/asset/2bed03a9-379b-4dc0-b72e-009604e29bfe/dijn_a_51881_f0006_b.jpg)
Figure 7 Effect of silver nanoparticles (AgNPs) on lactate dehydrogenase activity in MDA-MB-231 human breast cancer cells.
Notes: The cells were treated with various concentrations of AgNPs. The effect of AgNPs on lactate dehydrogenase activity was measured by changes in optical densities due to nicotinamide adenine dinucleotide (NAD) reduction that were monitored at 490 nm, using Roche’s cytotoxicity detection lactate dehydrogenase kit. The results represent the means of three separate experiments, and error bars represent the standard error of the mean. Treated groups showed statistically significant differences from the control group with Student’s t-test (P<0.05).
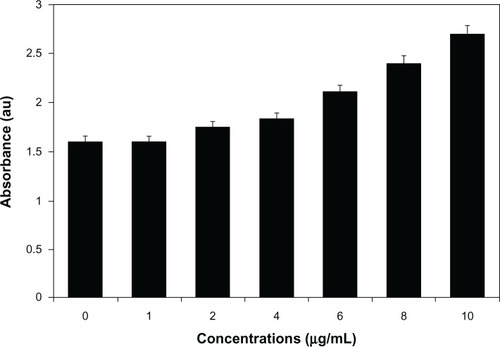
Figure 8 Silver nanoparticles (AgNPs) induce reactive oxygen species (ROS) generation in MDA-MB-231 human breast cancer cells. Relative fluorescence of 2′,7′-dichlorofluorescein was measured using a spectrofluorometer with excitation at 485 nm and emission at 530 nm.
Notes: The results represent the means of three separate experiments, and error bars represent the standard error of the mean. Treated groups showed statistically significant differences from the control (CON) group with Student’s t-test (P<0.05).
Abbreviations: DOX, doxorubicin; Nac, N-acetyl-L-cysteine.
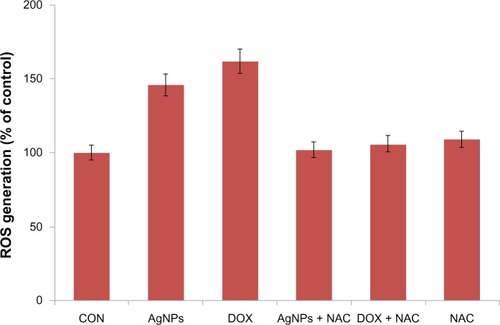
Figure 9 Silver nanoparticles (AgNPs) induce the activity of caspase 3 in MDA-MB-231 human breast cancer cells. MDA-MB-231 cells were treated with AgNPs, doxorubicin (DOX), and/or a caspase-3 inhibitor (Ac-DEVD-CHO) for 24 hours.
Notes: The concentration of the p-nitroaniline released from the substrate was calculated from the absorbance values at 405 nm. The results represent the means of three separate experiments, and error bars represent the standard error of the mean. Treated groups showed statistically significant differences from the control group with Student’s t-test (P<0.05).
Abbreviation: CON, control.
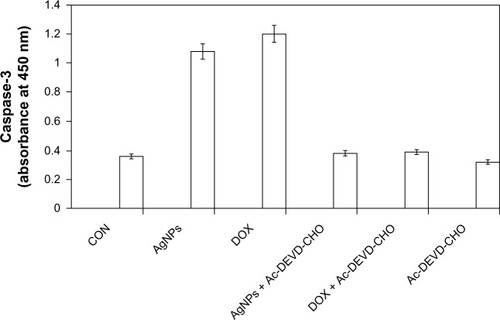
Figure 10 Effect of silver nanoparticles (AgNPs) on DNA fragmentation. MDA-MB-231 human breast cancer cells were treated with AgNPs for 24 hours, and DNA fragmentation was analyzed by agarose gel electrophoresis.
Notes: Lane M, 1 kB ladder; lane 1, control; lane 2, AgNPs (6 μg/mL); lane 3, doxorubicin (1 μM).
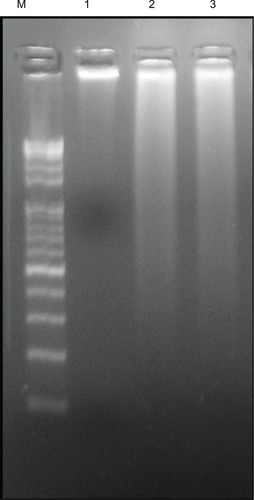
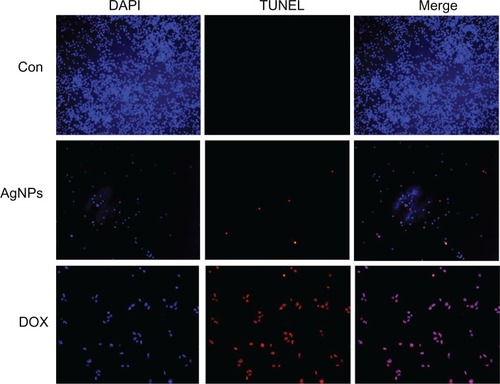
Figure 11 Terminal deoxynucleotidyl transferase deoxyuridine triphosphate nick-end labeling (TUNEL) assay. Fluorescent staining of MDA-MB-231 human breast cancer cells after 24 hours’ treatment with silver nanoparticles (AgNPs; 6 μg/mL) and doxorubicin (DOX; 1 μM) using TUNEL assay.
Note: Representative images are shown for apoptotic DNA fragmentation (red staining) and corresponding nuclei (blue staining).
Abbreviations: CON, control; DAPI, 4′,6-diamidino-2-phenylindole.