Figures & data
Figure 1 Effect of treatment with silicon dioxide nanoparticles on survival of human astrocytoma U87 cells. U87 cells were treated at specified concentrations of silicon dioxide nanoparticles for 48 hours. Values were the mean ± SEM of at least three separate experiments; CTRL represented the untreated (ie, control) U87 cells; * P < 0.05 versus control cells.
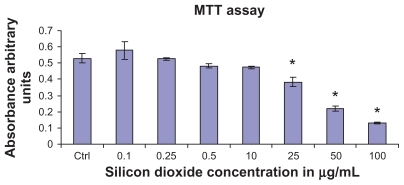
Figure 2 Effect of treatment with silicon dioxide nanoparticles on specific activities of citrate synthase in human astrocytoma U87 cells. U87 cells were treated at specified concentrations of silicon dioxide nanoparticles for 48 hours. Then the activities of citrate synthase in the homogenates of treated and untreated (ie, control, ctrl) U87 cells were determined as described in Materials and methods; the activities of citrate synthase were expressed per mg of homogenate protein as specific activities. The specific activities values were the mean ± SEM of at least three separate experiments; ctrl represented the value in untreated U87 cell homogenate; * P < 0.05 versus that of control cells.
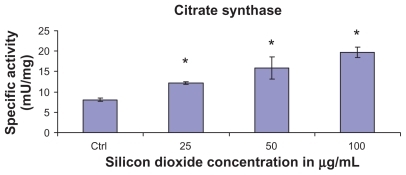
Figure 3 Effect of treatment with silicon dioxide nanoparticles on specific activities of malate dehydrogenase in human astrocytoma U87 cells. U87 cells were treated at specified concentrations of silicon dioxide nanoparticles for 48 hours. Then the activities of malate dehydrogenase in the homogenates of treated and untreated (ie, control, ctrl) U87 cells were determined as described in Materials and methods; the activities of malate dehydrogenase were expressed per mg of homogenate protein as specific activities. The specific activity values were the mean ± SEM of at least three separate experiments; ctrl represented the value in untreated U87 cell homogenate; * P < 0.05 versus that of control cells.
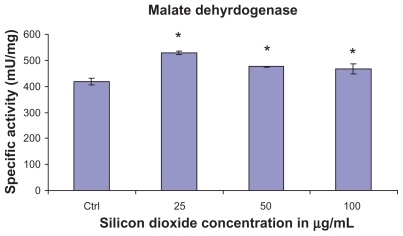
Figure 4 Effect of treatment with silicon dioxide nanoparticles on expression of cytochrome oxidase subunit II in human astrocytoma U87 cells. U87 cells were treated at specified concentrations of silicon dioxide nanoparticles for 48 hours. Then cell lysates of treated and untreated (ie, control) U87 cells were prepared as described in Materials and methods. The expression of cytochrome oxidase subunit II, encoded by mitochondrial DNA, was determined by Western blot analysis using β-actin as the loading control: Lane 1, lysate of untreated or control U87 cells; lane 2, lysate of U87 cells treated with silicon dioxide nanoparticles at 25 μg/mL; lane 3, lysate of U87 cells treated with silicon dioxide nanoparticles at 50 μg/mL; lane 4, lysate of U87 cells treated with silicon dioxide nanoparticles at 100 μg/mL. The blots were from a typical experiment. Two other experiments yielded essentially the same trend of results.

Figure 5 Effect of treatment with silicon dioxide nanoparticles on expression of nicotinamide adenine dinucleotide (NADH) dehydrogenase subunit 6 in human astrocytoma U87 cells. U87 cells were treated at specified concentrations of silicon dioxide nanoparticles for 48 hours. Then cell lysates of treated and untreated (ie, control) U87 cells were prepared as described in Materials and methods. The expression of NADH dehydrogenase subunit 6, encoded by mitochondrial DNA, was determined by Western blot analysis using β-actin as the loading control: Lane 1, lysate of untreated or control U87 cells; lane 2, lysate of U87 cells treated with silicon dioxide nanoparticles at 25 μg/mL; lane 3, lysate of U87 cells treated with silicon dioxide nanoparticles at 50 μg/mL; lane 4, lysate of U87 cells treated with silicon dioxide nanoparticles at 100 μg/mL. The blots were from a typical experiment. Two other experiments yielded essentially the same trend of results.
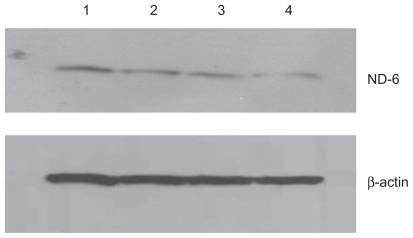
Figure 6 Effect of treatment with silicon dioxide nanoparticles on expression of extracellular signal regulated kinase (ERK) and phosphorylated ERK (p-ERK) in human astrocytoma U87 cells. U87 cells were treated at specified concentrations of silicon dioxide nanoparticles for 48 hours. Then cell lysates of treated and untreated (ie, control) U87 cells were prepared as described in Materials and methods. The expression of ERK and phosphorylated ERK was determined by Western blot analysis using β-actin as the loading control: Lane marked C, lysate of untreated or control U87 cells; lane marked 1, lysate of U87 cells treated with silicon dioxide nanoparticles at 1 μg/mL; lane marked 10, lysate of U87 cells treated with silicon dioxide nanoparticles at 10 μg/mL; lane marked 50, lysate of U87 cells treated with silicon dioxide nanoparticles at 50 μg/mL. The blots were from a typical experiment. Two other experiments yielded essentially the same trend of results.
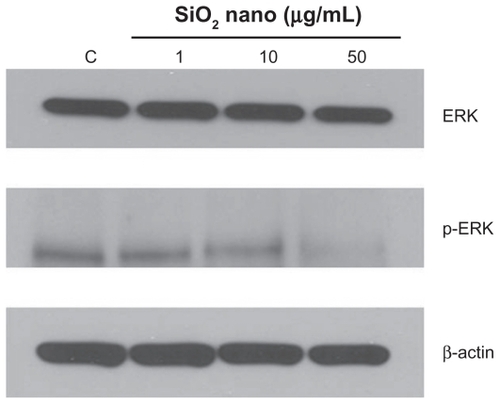
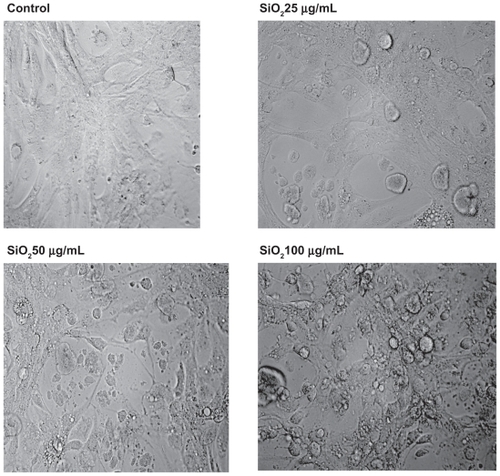
Figure 7 Effect of treatment with silicon dioxide nanoparticles on the morphology of human astrocytoma U87 cells. U87 cells were treated at specified concentrations of silicon dioxide nanoparticles for 48 hours. Then the morphology of treated and untreated (ie, control) U87 cells were assessed using bright field light microscopy at 400 × magnification as described in Materials and methods. The photomicrographs shown were representative of those obtained in several studies.