Figures & data
Figure 1 The AFM cell indentation experiment. A) The force curve obtained by measurements of cantilever deflection versus z-position during advancement and retraction of the probe. This curve provides information about the viscoelastic properties of the cell. Once the raw force curve is obtained and the contact point (Z0) identified, cell mechanical properties are obtained from the analysis of the curve of indentation force (F = k × h) versus depth (D = (Z − Z0) − h) B).
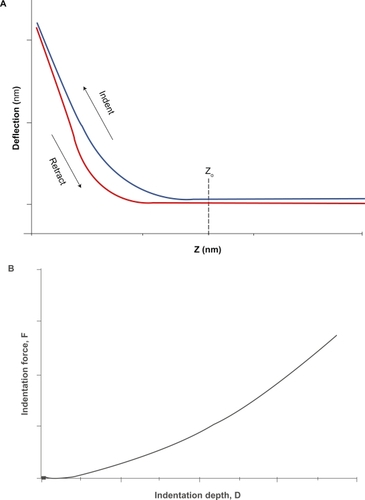
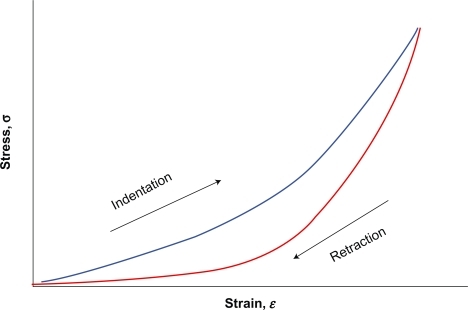
Figure 2 A nonlinear stress–strain relation (solid line) characterizes most biological soft tissues, with a viscoelastic hysteresis between loading and unloading segments of the curve, as opposed to the linear stress–strain curve of an idealized elastic material which is characterized by the Young’s modulus obtained from the slope of the line.