Figures & data
Figure 1 Properties of colloidal silica nanoparticle suspension.
Notes: (A) Hydrodynamic size, (B) zeta potential depending on the pH of deionized water, (C) hydrodynamic size, and (D) zeta potential at pH 7.0±0.4 in deionized water for colloidal silica nanoparticle suspension with (a) 20 nm diameter and (b) 100 nm diameter. Errors bars are based on polydispersity index.
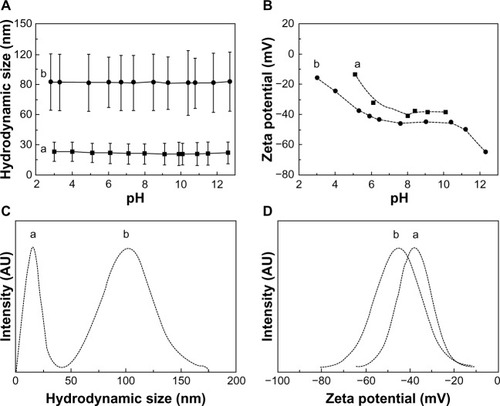
Table 1 Surface charge and colloidal stability of the colloidal silica with various coating agents in the 5.5–6.5 pH range
Figure 2 Chemical formula and positively charged groups of various coating reagents.
Note: EUDRAGIT® E-100, Evonik Industries, Essen, Germany.
Abbreviations: APTES, 3-aminopropyltriethoxysilane; EDA, ethylenediamine; TAEA, tris(2-aminoethyl)amine.
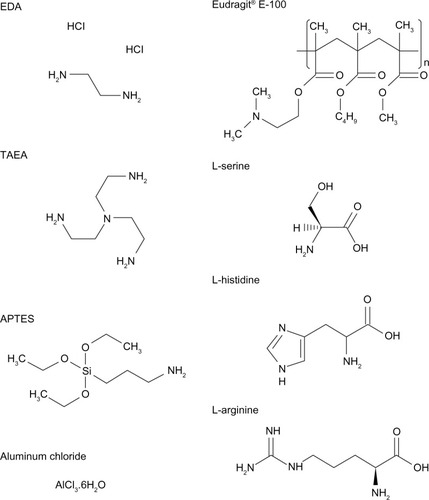
Figure 3 Zeta potential and hydrodynamic size of silica nanoparticles coated with L-serine.
Notes: (A) Zeta potential of colloidal silica nanoparticles with 20 nm diameter, (B) hydrodynamic size of colloidal silica nanoparticles with 20 nm diameter, (C) zeta potential of colloidal silica nanoparticles with 100 nm diameter, and (D) hydrodynamic size of colloidal silica nanoparticles with 100 nm diameter at pH 5.5, 6.0, and 6.5, and pristine silica depending on the time, respectively. Open or solid squares/triangles/circles represent L-serine coated or uncoated samples at pH 5.5, 6.0, and 6.5, respectively.
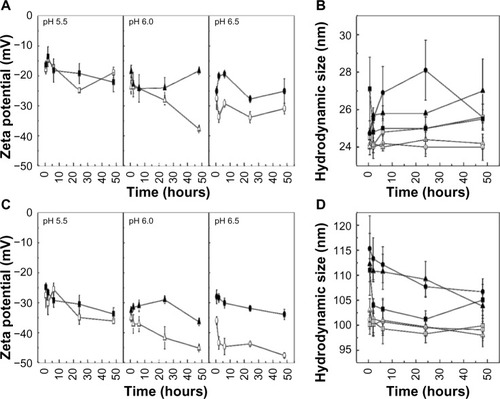
Figure 4 Zeta potential and hydrodynamic size of silica nanoparticles with L-histidine.
Notes: (A) Zeta potential of colloidal silica nanoparticles with 20 nm diameter, (B) hydrodynamic size of colloidal silica nanoparticles with 20 nm diameter, (C) zeta potential of colloidal silica nanoparticles with 100 nm diameter, and (D) hydrodynamic size of colloidal silica nanoparticles with 100 nm diameter at pH 5.5, 6.0, and 6.5, and pristine silica depending on the time, respectively. Open or solid squares/triangles/circles represent L-histidine coated or uncoated samples at pH 5.5, 6.0, and 6.5, respectively.
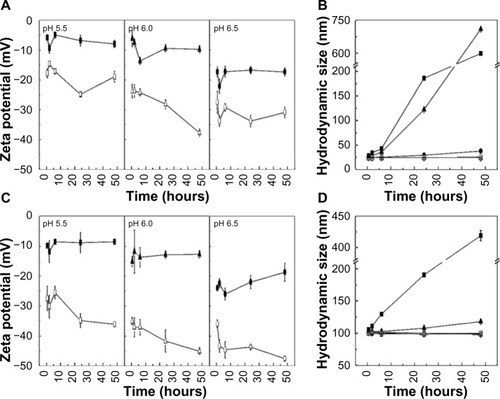
Figure 5 Zeta potential and hydrodynamic size of silica nanoparticles coated with L-arginine.
Notes: (A) Zeta potential of colloidal silica nanoparticles with 20 nm diameter, (B) hydrodynamic size of colloidal silica nanoparticles with 20 nm diameter, (C) zeta potential of colloidal silica nanoparticles with 100 nm diameter, and (D) hydrodynamic size of colloidal silica nanoparticles with 100 nm diameter at pH 5.5, 6.0, and 6.5, and pristine silica depending on the time, respectively. Open or solid squares/triangles/circles represent L-arginine coated or uncoated samples at pH 5.5, 6.0, and 6.5, respectively.
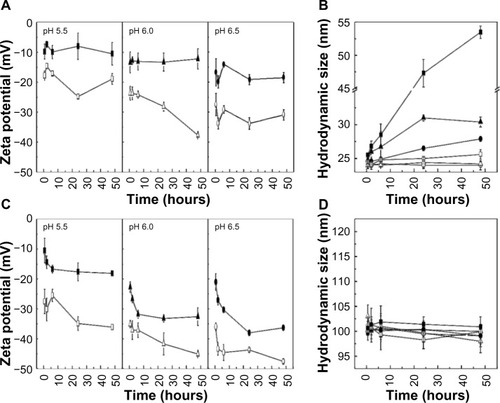
Figure 6 Time dependent turbidity of silica nanoparticles coated with L-arginine.
Notes: (A) Silica nanoparticles with 20 nm diameter and (B) hydrodynamic size of colloidal silica nanoparticles with 100 nm diameter at pH (a) 5.5, (b) 6.0, and (c) 6.5 depending on the time. The measurement data for 48 hours are represented by arrows. Gradations in color from dark grey (0 hours) to black (48 hours).
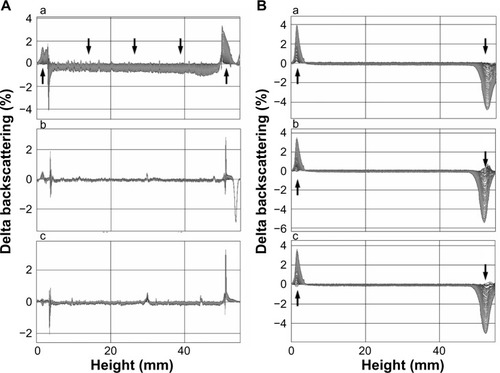
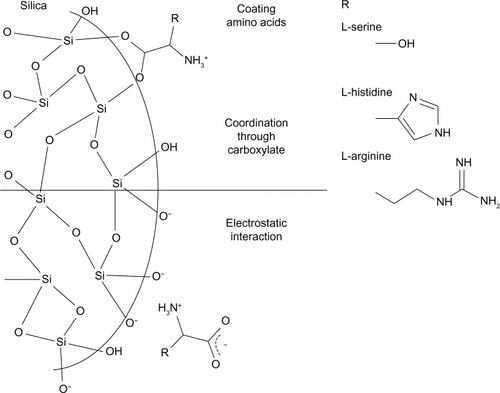
Figure 7 Suggested schematic illustration of the interaction between the silica nanoparticles and the amino acids.