
Figures & data
Table 1 Results of dose formulation analysis in the 90-day oral-toxicity study of zinc oxide (ZnOSM20(+)) nanoparticles
Table 2 Experimental design of the 90-day oral-toxicity study of 20 nm, negatively charged zinc oxide (ZnOSM20(+)) nanoparticles
Table 3 Food Consumptions
Table 4 Water consumption
Figure 1 Body-weight changes in male (A) and female (B) rats.
Notes: G1: negative control; G2: vehicle control; G3: NPs 125 mg/kg; G4: NPs 250 mg/kg; G5: NPs 500 mg/kg.
Abbreviation: NPs, nanoparticles.
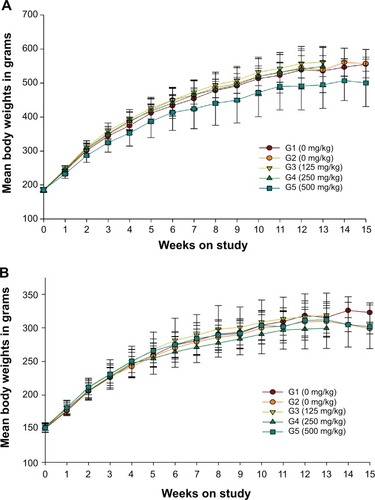
Table 5 Organ-weight-to-body-weight ratios for male and female rats in the primary 90-day oral-toxicity studyTable Footnote*
Table 6 Organ-weight-to-body-weight ratios for male and female rats in the 14-day recovery studyTable Footnote*
Table 7 Hematology data for male and female rats in the primary 90-day oral-toxicity study
Table 8 Hematology data for male and female rats in the 14-day recovery study
Table 9 Clinical chemistry data for male and female rats in the primary 90-day oral-toxicity study
Table 10 Histopathology results
Figure 2 Histopathological findings of the pancreas and the outer layer of the retina.
Notes: (A) Normal microscopic structure of the pancreas of a male Sprague Dawley (SD) rat administered 0 mg/kg zinc oxide (ZnO) by gavage for 90 days. Note the normal acinar cell (NA) in the pancreas. (B) Acinar cell atrophy (A), acinar cell apoptosis (arrows), and an interstitial inflammatory cell infiltration (I) in the pancreas of an SD rat administered 500 mg/kg ZnO by gavage for 90 days. Note the chronic inflammation (including “A”, arrows, and “I”) in the pancreas. (C) Normal microscopic structure of the eye of a male SD rat administered 0 mg/kg ZnO by gavage for 90 days. Note the normal outer layer of retina (N) in the eye. (D) Remarkable retinal atrophy in the eye of a male SD rat administered 500 mg/kg ZnO by gavage for 90 days. Note the retinal atrophy (R) in the outer layer of the retina of the eye. Scale bar: 100 mm; hematoxylin and eosin staining.
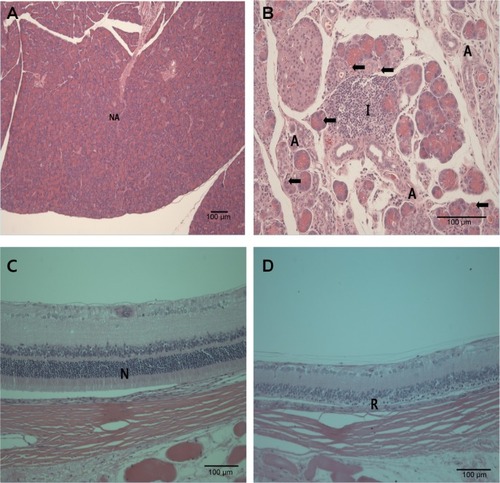
Figure 3 Histopathological findings of limiting ridge and glandular stomach.
Notes: (A) Normal limiting ridge of the stomach of a male Sprague Dawley (SD) rat administered 0 mg/kg zinc oxide (ZnO) nanoparticles. Note the normal epithelium (NE) in the forestomach. (B) Squamous cell hyperplasia (H) and squamous cell vacuolation (arrows) in the limiting ridge of the forestomach of an SD rat administered 500 mg/kg ZnO by gavage for 90 days. Note the squamous cell hyperplasia (H) in the forestomach. (C) Normal glandular stomach of a male SD rat administered 0 mg/kg ZnO by gavage for 90 days. Note the normal mucosa (N) in the glandular stomach. (D) Eosinophilic chief cells (arrows) in the glandular stomach of a male SD rat administered 500 mg/kg ZnO by gavage for 90 days. Scale bar: 100 mm; hematoxylin and eosin staining.
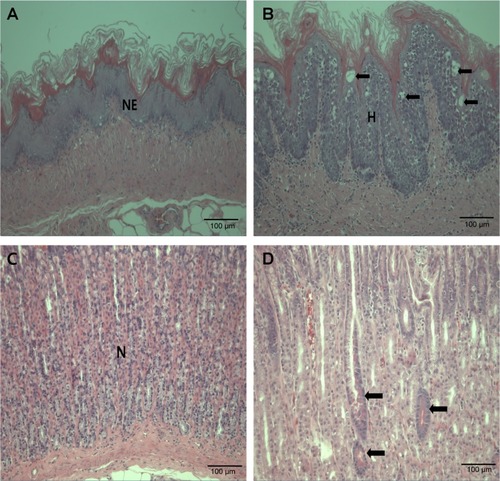
Figure 4 Histopathological findings of glandular stomach.
Notes: (A) Normal glandular stomach of a male Sprague Dawley (SD) rat in 0 mg/kg zinc oxide (ZnO). Note the normal submucosa (NS) in the glandular stomach. (B) Submucosal inflammatory cell infiltration (SI) in glandular stomach of a male SD rat administered 500 mg/kg ZnO by gavage for 90 days. (C) Normal glandular stomach of a male SD rat administered 0 mg/kg ZnO by gavage for 90 days. Note the normal parietal cell distribution (arrows) in the glandular stomach. (D) Mucous cell hyperplasia (arrows) – stained blue – in the glandular stomach of a male SD rat administered 500 mg/kg ZnO by gavage for 90 days. Scale bar: 100 mm; A and B, hematoxylin and eosin staining; C and D, Alcian Blue staining.
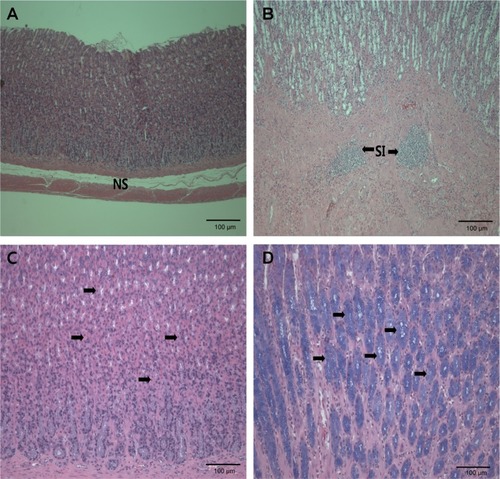
Table 11 Tissue distribution