
Figures & data
Figure 1 Effect of differently sized and electrostatic charged SiO2 NPs on the viability of murine macrophage RAW 264.7 cells.
Notes: Cells were incubated with indicated concentrations of colloidal SiO2 NPs: (A) SiO2EN20(−); (B) SiO2EN100(−); (C) SiO2EN20(R); and (D) SiO2N100(R) for 24 hours. Cells not treated with SiO2 NPs served as the control in the experiment. A commercially available cell viability assay Cell Counting Kit-8 was used to evaluate the cytotoxicity effect of the SiO2 NPs according to manufacturer’s instructions (Dojindo Molecular Technologies, Inc., Rockville, MD, USA). Data are presented as the mean ± standard deviation. *P<0.05; **P<0.01; ***P<0.001 versus control (0 μg/mL).
Abbreviations: SiO2EN(−), negatively charged silicon dioxide; SiO2EN(R), silicon dioxide modified with L-arginine; SiO2, silicon dioxide; NPs, nanoparticles.
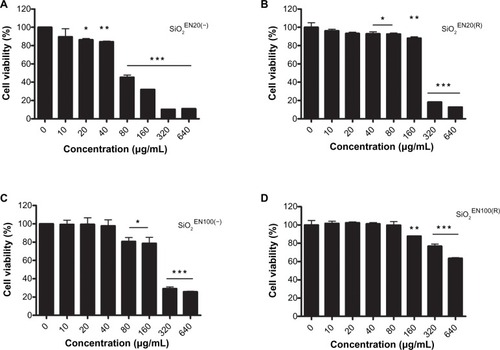
Figure 2 The effect on body weight of SiO2 NPs fed to mice.
Notes: C57BL/6 mice were treated with varying sizes (20 nm, 100 nm) and charges (SiO2EN[R]; negative, SiO2EN[−]) of 750 mg/kg colloidal SiO2 NPs for 14 days. Body weight was measured all throughout the experiment period, and it served as one of the primary indicators of SiO2 NP immune toxicity. Data are presented as the mean ± standard deviation; n=5.
Abbreviations: NC, normal control; SiO2EN(−), negatively charged silicon dioxide; SiO2EN(R), silicon dioxide modified with L-arginine; SiO2, silicon dioxide; NP, nanoparticle; n, number.
![Figure 2 The effect on body weight of SiO2 NPs fed to mice.Notes: C57BL/6 mice were treated with varying sizes (20 nm, 100 nm) and charges (SiO2EN[R]; negative, SiO2EN[−]) of 750 mg/kg colloidal SiO2 NPs for 14 days. Body weight was measured all throughout the experiment period, and it served as one of the primary indicators of SiO2 NP immune toxicity. Data are presented as the mean ± standard deviation; n=5.Abbreviations: NC, normal control; SiO2EN(−), negatively charged silicon dioxide; SiO2EN(R), silicon dioxide modified with L-arginine; SiO2, silicon dioxide; NP, nanoparticle; n, number.](/cms/asset/19ace998-4d2c-4905-9a38-218fcd582d97/dijn_a_57934_f0002_b.jpg)
Table 1 Total WBC and type of WBC counts in L-arginine surface modified SiO2 NP-fed mice
Table 2 Total WBC and type of WBC counts in negatively charged SiO2 NP-fed mice
Figure 3 The effect on primary lymphocyte proliferation of SiO2 NPs fed to mice.
Notes: C57BL/6 mice were treated with varying sizes (20 nm, 100 nm) and charges (SiO2EN[R]; negative, SiO2EN[−]) of 750 mg/kg colloidal SiO2 NPs for 14 days. At the end of the treatment period, single-cell suspensions were made from spleens of mice, and the proliferation of (A) B-cells and (B) T-cells were assessed. Data are presented as the mean ± standard deviation; n=5. *P<0.05, **P<0.01, and ***P<0.001 indicate significant differences when tested with ANOVA. Tukey’s test was used for post hoc tests.
Abbreviations: NC, normal control; SiO2, silicon dioxide; SiO2EN(−), negatively charged silicon dioxide; SiO2EN(R), silicon dioxide modified with L-arginine; NP, nanoparticle; n, number; ANOVA, analysis of variance.
![Figure 3 The effect on primary lymphocyte proliferation of SiO2 NPs fed to mice.Notes: C57BL/6 mice were treated with varying sizes (20 nm, 100 nm) and charges (SiO2EN[R]; negative, SiO2EN[−]) of 750 mg/kg colloidal SiO2 NPs for 14 days. At the end of the treatment period, single-cell suspensions were made from spleens of mice, and the proliferation of (A) B-cells and (B) T-cells were assessed. Data are presented as the mean ± standard deviation; n=5. *P<0.05, **P<0.01, and ***P<0.001 indicate significant differences when tested with ANOVA. Tukey’s test was used for post hoc tests.Abbreviations: NC, normal control; SiO2, silicon dioxide; SiO2EN(−), negatively charged silicon dioxide; SiO2EN(R), silicon dioxide modified with L-arginine; NP, nanoparticle; n, number; ANOVA, analysis of variance.](/cms/asset/e2e572c3-e649-43c5-b167-f167e4458bbb/dijn_a_57934_f0003_b.jpg)
Figure 4 The effect on NO and ROS production of SiO2 NPs fed to mice.
Notes: C57BL/6 mice were treated with varying sizes (20 nm, 100 nm) and charges (SiO2EN(R); negative, SiO2EN(−)) of 750 mg/kg colloidal SiO2 NPs for 14 days. The supernatant of splenocytes from mice were harvested and (A) NO2− accumulation was assessed using the Griess colorimetric assay according to manufacturer’s instructions (Promega Corporation, Fitchburg, WI, USA), and (B) intracellular ROS accumulation was detected by fluorescent probe 2′,7′-dichlorodihydrofluorescein diacetate using a fluorescence microplate reader. Data are presented as the mean ± standard deviation; n=5. *P<0.05, and **P<0.01 indicate significant differences when tested with ANOVA. Tukey’s test was used for post hoc tests.
Abbreviations: NC, normal control; SiO2, silicon dioxide; SiO2EN(−), negatively charged silicon dioxide; SiO2EN(R), silicon dioxide modified with L-arginine; NP, nanoparticle; NO, nitric oxide; ROS, reactive oxygen species; NO2−, nitrate; n, number; ANOVA, analysis of variance.
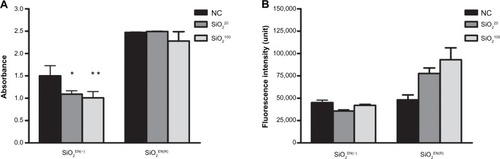
Figure 5 The effect on antioxidant activity of SiO2 NPs fed to mice.
Notes: C57BL/6 mice were treated with varying sizes (20 nm, 100 nm) and charges (SiO2EN[R]; negative, SiO2EN[−]) of 750 mg/kg colloidal SiO2 NPs for 14 days. Spleens from mice were isolated aseptically and made into single-cell suspension splenocytes. (A) SOD activity and (B) GPx activity were measured in splenocyte lysate by an SOD activity assay kit and by a GPx activity colorimetric assay kit, according to the manufacturer’s instructions (BioVision, Inc., Milpitas, CA, USA). Data are presented as the mean ± standard deviation; n=5.
Abbreviations: SOD, superoxide dismutase; NC, normal control; SiO2, silicon dioxide; SiO2EN(−), negatively charged silicon dioxide; SiO2EN(R), silicon dioxide modified with L-arginine; GPx, glutathione peroxidase; n, number.
![Figure 5 The effect on antioxidant activity of SiO2 NPs fed to mice.Notes: C57BL/6 mice were treated with varying sizes (20 nm, 100 nm) and charges (SiO2EN[R]; negative, SiO2EN[−]) of 750 mg/kg colloidal SiO2 NPs for 14 days. Spleens from mice were isolated aseptically and made into single-cell suspension splenocytes. (A) SOD activity and (B) GPx activity were measured in splenocyte lysate by an SOD activity assay kit and by a GPx activity colorimetric assay kit, according to the manufacturer’s instructions (BioVision, Inc., Milpitas, CA, USA). Data are presented as the mean ± standard deviation; n=5.Abbreviations: SOD, superoxide dismutase; NC, normal control; SiO2, silicon dioxide; SiO2EN(−), negatively charged silicon dioxide; SiO2EN(R), silicon dioxide modified with L-arginine; GPx, glutathione peroxidase; n, number.](/cms/asset/10536c16-132f-4382-8184-32ac7ce23665/dijn_a_57934_f0005_b.jpg)
Table 3 NK cell activity in SiO2 NP-fed mice
Table 4 Serum cytokine concentration in mice exposed to SiO2