Figures & data
Table 1 Administration concentrations and volumes of 28-day repeated oral administrations in rats
Table 2 Administration concentrations and volumes for 90-day SiO2EN100(R) and SiO2EN20(R) oral administrations and SiO2EN100(−) and SiO2EN20(−) dermal administrations
Figure 1 Standard curve of Evans blue.
Note: Evans blue dye (Sigma-Aldrich Co., St Louis, MO, USA).
Abbreviation: OD, optical density.
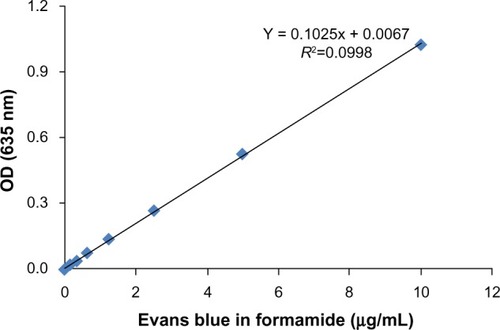
Figure 2 The difference value between ZnO NP treated groups and control groups.
Notes: (A) OD value of each brain region extracted from ZnOSM20(+)- and ZnOSM20(−)-treated rats; (B) each brain region of the amount of Evans blue per unit (g). Evans blue dye (Sigma-Aldrich Co., St Louis, MO, USA).
Abbreviations: OD, optical density; ZnO, zinc oxide; NP, nanoparticle.
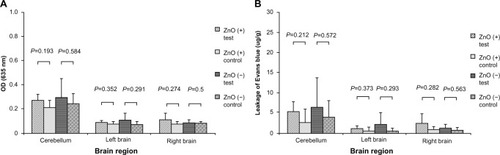
Figure 3 The difference value between SiO2 NP treated groups and control groups.
Notes: (A) OD value of each brain region extracted from SiO2EN20(R)- and SiO2EN20(−)-treated rats; (B) each brain region of the amount of Evans blue per unit (g).
Abbreviations: OD, optical density; SiO2, silica; NP, nanoparticle.
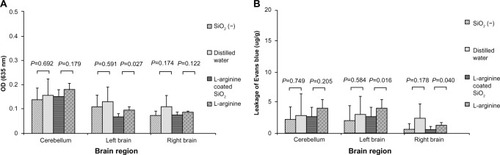
Figure 4 Detection of the neuron-specific protein NeuN on rat left hemispheres.
Notes: Cerebellum regions of tested rats are pictured and organized according to zinc oxide (ZnO) character (particle sizes [20 and 100 nm], positively and negatively charged surfaces, and injected concentrations), as indicated by black bars. (A) Phosphate-buffered saline-injected control normal rat brain of cerebellum region; (B) 10 mg of ZnOSM20(+); (C) 0.1 mg of ZnOSM20(+); (D) 10 mg of ZnOSM20(−); (E) 0.1 mg of ZnOSM20(−); (F) 10 mg of ZnOSM100(+); (G) 0.1 mg of ZnOSM100(+); (H) 10 mg of ZnOSM100(−); (I) 0.1 mg of ZnOSM100(−).
![Figure 4 Detection of the neuron-specific protein NeuN on rat left hemispheres.Notes: Cerebellum regions of tested rats are pictured and organized according to zinc oxide (ZnO) character (particle sizes [20 and 100 nm], positively and negatively charged surfaces, and injected concentrations), as indicated by black bars. (A) Phosphate-buffered saline-injected control normal rat brain of cerebellum region; (B) 10 mg of ZnOSM20(+); (C) 0.1 mg of ZnOSM20(+); (D) 10 mg of ZnOSM20(−); (E) 0.1 mg of ZnOSM20(−); (F) 10 mg of ZnOSM100(+); (G) 0.1 mg of ZnOSM100(+); (H) 10 mg of ZnOSM100(−); (I) 0.1 mg of ZnOSM100(−).](/cms/asset/d73049eb-086f-48fb-9813-7848079a6ebc/dijn_a_58205_f0004_b.jpg)
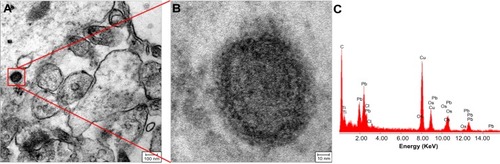
Figure 5 Silica nanoparticle in SH-SY5Y neuroblastoma cell.
Notes: (A) Transmission electron microscope image of SH-SY5Y neuroblastoma cells treated with SiO2EN100(–); (B) graph of energy-dispersive X-ray spectroscope analysis. The green circle highlights the Si peak.
Abbreviations: Fe, iron; Nb, niobium; O, oxygen; Pb, lead; Si, silicon; SiO2, silica; Zn, zinc.
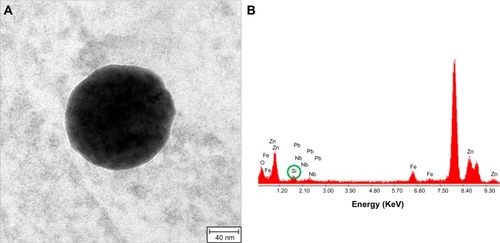
Figure 6 Transmission electron microscope images of the brain regions of a silica (SiO2) repeatedly treated rats.
Notes: (A–C) Dermally administered SiO2EN20(−); (D–F) dermally administered SiO2EN100(−); (G–I) orally administered SiO2EN20(R); (J–L) orally administered SiO2EN100(R).
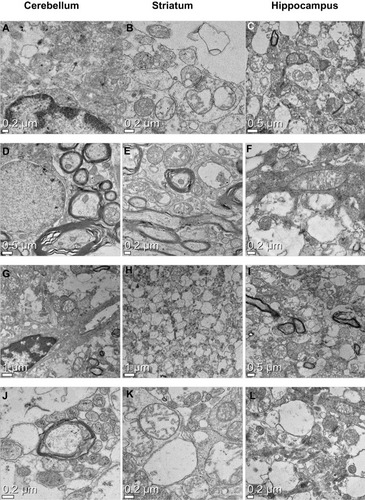
Figure 7 The results of energy-dispersive X-ray spectroscope analysis of SiO2EN20(–)-treated rat hippocampus via dermal administration.
Notes: A and B are examples of suspected nano-size dot and graph of energy-dispersive X-ray spectroscope analysis.
Abbreviations: Ca, calcium; Cl, chlorine; Cu, copper; Fe, iron; O, oxygen; OS, osmium; P, phosphorus; SiO2, silica; EDS, energy-dispersive X-ray spectroscope.
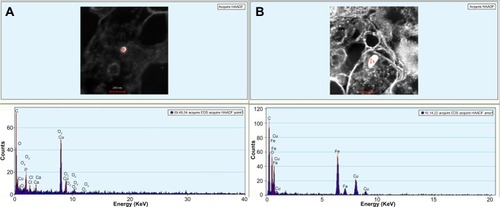
Figure 8 Analysis of suspected nano-size dot in SiO2EN100(−) dermal administration group.
Notes: (A) Transmission electron microscope image of hippocampus in SiO2EN100(–) dermal administration group; (B) enlarged image of suspected substance; (C) graph of energy-dispersive X-ray spectroscope analysis.
Abbreviations: C, carbon; Cl, chlorine; Cu, copper; Os, osmium; Pb, lead; SiO2, silica; Ti, titanium.