Figures & data
Figure 1 FMR (solid line) and XRF (dashed line) calibration curves of the SPIONs related to the area under the resonance line at g = 2.1 and the characteristic FeKa line, respectively. In the inset A) there are seen typical FMR spectra for different concentrations of iron, corresponding to the characteristic line of magnetite contained in the ferrofluid Endorem™. Inset B) shows the characteristic FeKa line of XRF, proportional to the iron concentration in the sample.
Abbreviations: FMR, ferromagnetic resonance; SPIONs, superparamagnetic iron oxide nanoparticles; XRF, X-ray fluorescence.
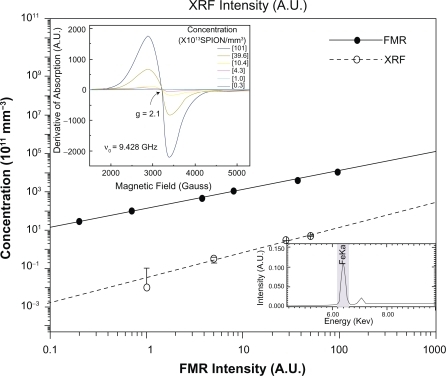
Figure 2 FMR calibration curve of the SPIONs concentration related with the area under the resonance absorption curve at g = 2.1. In the inset there are presented the typical FMR spectra at different concentrations of magnetite contained in the ferrofluid.
Abbreviations: FMR, ferromagnetic resonance; SPIONs, superparamagnetic iron oxide nanoparticles.
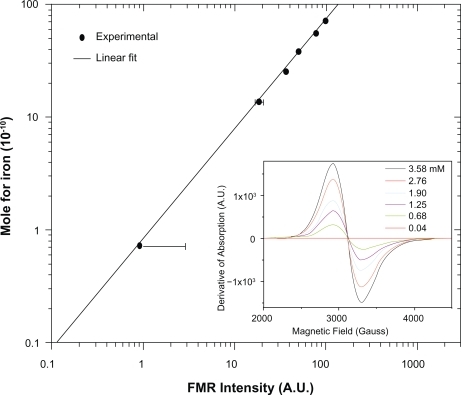
Figure 3 A) Micrograph of liver colored by the Prussian blue from tissues of control animals. B) Micrograph of liver after the SPIONs administration, making evident the presence of the nanoparticles in the tissue; bar = 40 μm.
Abbreviation: SPIONs, superparamagnetic iron oxide nanoparticles.
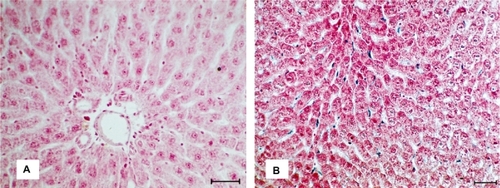
Figure 4 A) TEM of the control stem cells CD133−. B, C) TEM of the CD133+ stem cells labeled with SPIONs. D) TEM of the CD133+ cells of not conserved morphology. n = nucleus, c = cytoplasm, arrow 1 = electrondense granules on the cell surface, arrow 2 = electrondense granules in the cell cytoplasm. Scale: A) 1.0 μm; B, C) 0.25 μm; D) 0.5 μm.
Abbreviations: SPIONs, superparamagnetic iron oxide nanoparticles; TEM, transmission electron microscopy.
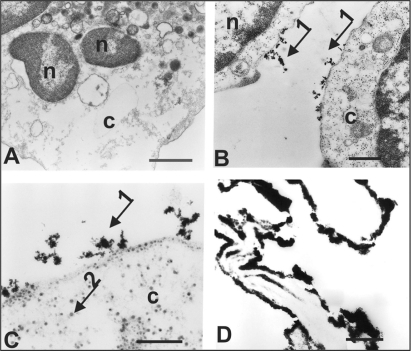
Figure 5 FMR spectra showing the derivative of the absorption of the SPIONs of Fe3O4, labeled cells, not labeled cells, and the 0.5% glutaraldehyde fixator.
Abbreviations: FMR, ferromagnetic resonance; SPIONs, superparamagnetic iron oxide nanoparticles.
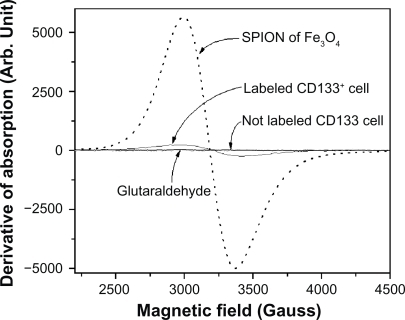
Table 1 Parameters obtained from the curve adjustments of Figures 5 and 7 of Gamarra and colleagues.Citation25 (FMR and XRF data) for the study of the kinetics of elimination from the blood and biodistribution in the liver. Each parameter of the curves was determined from the average value obtained from the results of the measurements of three samples per experimental point