Figures & data
Figure 1 Schematic illustration of NanoClik nanoparticle formation. (A) Chemical structures of the CHPOA and PEGSH. (B) CHPOA were crosslinked with PEGSH by Michael addition.
Abbreviations: CHPOA, acryloyl group-modified cholesterol-bearing pullulan; PEGSH, pentaerythritol tetra (mercaptoethyl) polyoxyethylene.
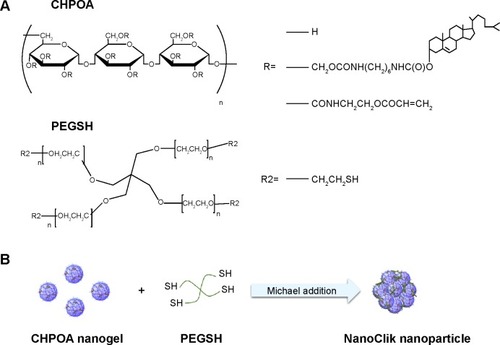
Figure 2 Schematic diagram of experimental protocol for murine bone resorption model induced by a low calcium diet.
Notes: All mice were fed a normal calcium diet containing 0.5% calcium and 0.35% phosphorus for 3 days, and then one group (n=5 per group) was fed a normal calcium diet, while the other five groups were fed a low calcium diet containing 0.05% calcium and 0.35% phosphorus for the next 4 days. The arrows indicate the time points of once-daily subcutaneous injections of vehicle (NanoClik nanoparticles, NanoClik), W9 (24 mg/kg/day) only, W9 (24 mg/kg/day) incorporated in CHP nanogels or W9 (8 and 24 mg/kg/day) incorporated in NanoClik nanoparticles. All mice were sacrificed on day 4 after starting the low calcium diet.
Abbreviations: Ca, calcium; CHP, cholesterol-bearing pullulan.
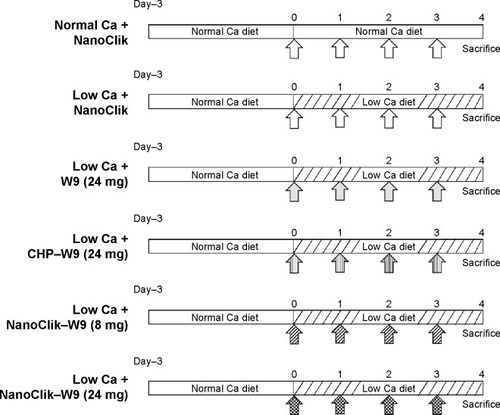
Figure 3 Findings of radiological assessments of the proximal tibiae.
Notes: (A) Three-dimensional reconstruction microfocal CT images of the proximal tibiae (upper panel) and the secondary spongiosa in the metaphysis of the proximal tibiae (lower panel). The trapezoidal frame in the upper panels indicates the area shown in the magnified images in the lower panels. The scale bar represents 500 μm. (B) Trabecular BMD of the proximal tibiae measured by peripheral quantitative CT. The six experimental groups shown in the figure are as follows: normal Ca + NanoClik (n=5), vehicle (NanoClik nanoparticle)-injected mice fed a normal calcium diet; low Ca + NanoClik (n=5), vehicle (NanoClik nanoparticle)-injected mice fed a low calcium diet; low Ca + W9 (24 mg, n=5), W9 (24 mg/kg/day) was injected into mice fed a low calcium diet; low Ca + CHP-W9 (24 mg, n=5), W9 (24 mg/kg/day) incorporated in CHP nanogels was injected into mice fed a low calcium diet; low Ca + NanoClik-W9 (8 mg, n=5), W9 (8 mg/kg/day) incorporated in NanoClik nanoparticles was injected into mice fed a low calcium diet; low Ca + NanoClik-W9 (24 mg, n=5), W9 (24 mg/kg/day) incorporated in NanoClik nanoparticles was injected into mice fed a low calcium diet. Data are shown as the mean ± standard deviation, with n=5 for each experimental group. *P<0.05 versus normal Ca + NanoClik; #P<0.05 versus low Ca + NanoClik.
Abbreviations: BMD, bone mineral density; Ca, calcium; CHP, cholesterol-bearing pullulan; CT, computed tomography.
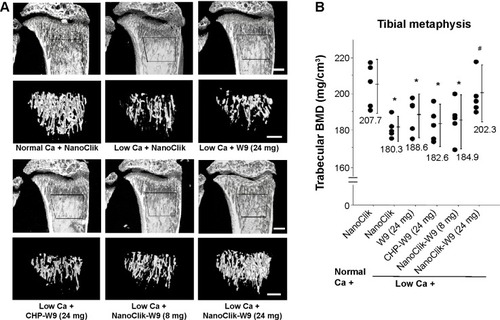
Figure 4 Mineralized tissue in cancellous region of tibial metaphysis.
Notes: (A) Photomicrographs of undecalcified sagittal sections (5 μM) of the proximal tibiae with von Kossa staining and counterstained using a modified van Gieson method. The scale bar represents 500 μm. The area of mineralized tissue is shown in black. (B) Trabecular bone volume, (C) trabecular number, (D) trabecular separation, and (E) trabecular thickness. Data are shown as the mean ± standard deviation, with n=5 for each experimental group. *P<0.05 versus normal Ca + NanoClik; #P<0.05, versus low Ca + NanoClik.
Abbreviations: BMD, bone mineral density; Ca, calcium; CHP, cholesterol-bearing pullulan; Normal Ca + NanoClik (n=5), vehicle (NanoClik nanoparticle)-injected mice fed a normal calcium diet; low Ca + NanoClik (n=5), vehicle (NanoClik nanoparticle)-injected mice fed a low calcium diet; low Ca + W9 (24 mg, n=5), W9 (24 mg/kg/day) was injected into mice fed a low calcium diet; low Ca + CHP-W9 (24 mg, n=5), W9 (24 mg/kg/day) incorporated in CHP nanogels was injected into mice fed a low calcium diet; low Ca + NanoClik-W9 (8 mg, n=5), W9 (8 mg/kg/day) incorporated in NanoClik nanoparticles was injected into mice fed a low calcium diet; low Ca + NanoClik-W9 (24 mg, n=5), W9 (24 mg/kg/day) incorporated in NanoClik nanoparticles was injected into mice fed a low calcium diet.
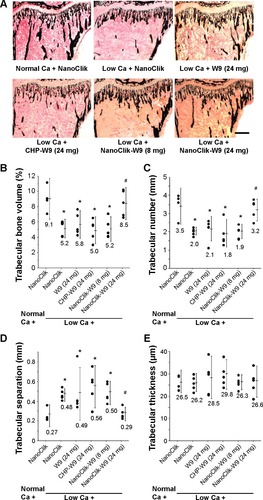
Figure 5 Treatment with W9 24 mg/kg/day complexed in NanoClik nanoparticles prevented the increase in bone resorption parameters induced by a low calcium diet.
Notes: (A) Histological observations of the proximal tibiae. TRAP-positive cells are shown in red. TRAP-positive multinucleated cells were designated as osteoclasts. The scale bar represents 50 μm. (B) Number of osteoclasts per bone surface and (C) osteoclast surface per bone surface. Data are shown as the mean ± standard deviation, with n=5 for each experimental group. *P<0.05 versus normal Ca + NanoClik; #P<0.05 versus low Ca + NanoClik.
Abbreviations: Ca, calcium; CHP, cholesterol-bearing pullulan; Oc. S/BS, osteoclast surface per bone surface; N. Oc/BS, number of osteoclasts per bone surface; TRAP, tartrate-resistant acid phosphatase; Normal Ca + NanoClik (n=5), vehicle (NanoClik nanoparticle)-injected mice fed a normal calcium diet; low Ca + NanoClik (n=5), vehicle (NanoClik nanoparticle)-injected mice fed a low calcium diet; low Ca + W9 (24 mg, n=5), W9 (24 mg/kg/day) was injected into mice fed a low calcium diet; low Ca + CHP-W9 (24 mg, n=5), W9 (24 mg/kg/day) incorporated in CHP nanogels was injected into mice fed a low calcium diet; low Ca + NanoClik-W9 (8 mg, n=5), W9 (8 mg/kg/day) incorporated in NanoClik nanoparticles was injected into mice fed a low calcium diet; low Ca + NanoClik-W9 (24 mg, n=5), W9 (24 mg/kg/day) incorporated in NanoClik nanoparticles was injected into mice fed a low calcium diet.
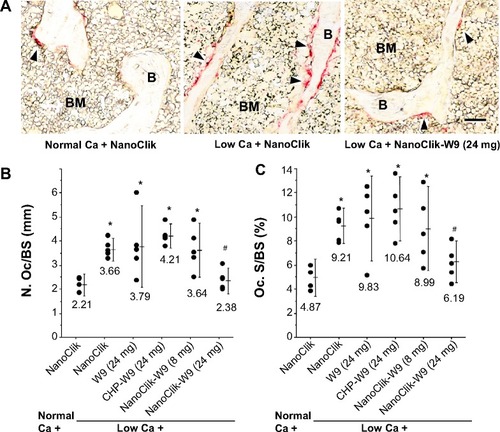
Figure 6 Serum levels of collagen crosslinks.
Notes: Levels of serum CTX, a bone resorption marker, were analyzed by enzyme-linked immunoassay. Data are shown as the mean ± standard deviation, with n=5 for each experimental group. *P<0.05 versus normal Ca + NanoClik; #P<0.05 versus low Ca + NanoClik.
Abbreviations: Ca, calcium; CTX, C-terminal telopeptide of type 1 collagen; Normal Ca + NanoClik (n=5), vehicle (NanoClik nanoparticle)-injected mice fed a normal calcium diet; low Ca + NanoClik (n=5), vehicle (NanoClik nanoparticle)-injected mice fed a low calcium diet; low Ca + NanoClik-W9 (24 mg, n=5), W9 (24 mg/kg/day) incorporated in NanoClik nanoparticles was injected into mice fed a low calcium diet.
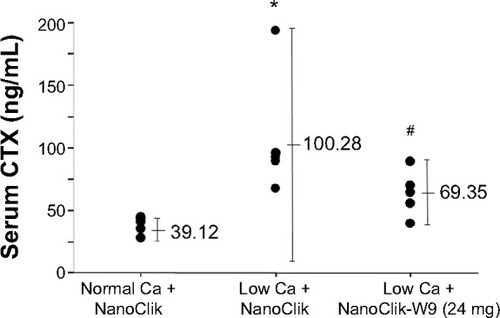
Figure 7 Three-day culture of NanoClik-W9 in 10% FBS was not enough to inhibit osteoclastogenesis, but culture in 50% FBS was sufficient for in vitro inhibition of osteoclastogenesis.
Notes: (A) Schematic diagram of the experimental protocol to clarify W9 release mechanism from nanogels in vitro. Murine bone marrow cells were cultured in the presence of 10% FBS, 25 ng/mL M-CSF, and 5 ng/mL RANKL for one day to obtain bone marrow-derived osteoclast precursors. The precursors were then further incubated for 3 days in the presence of 10% FBS, 25 ng/mL M-CSF, and 100 ng/mL RANKL with the materials used in the in vivo study, ie, vehicle (0.05% dimethyl sulfoxide), W9 alone, CHP nanogels, W9 incorporated in CHP nanogels (CHP-W9), NanoClik nanoparticles (NanoClik), and W9 incorporated in NanoClik nanoparticles (NanoClik-W9). (B) Representative microscopic images of osteoclast cultures on day 4. TRAP-positive cells are shown in red. The scale bar represents 200 μM. (C) TRAP-positive MNCs were counted (n>3). The percentage of TRAP-positive MNCs compared with the vehicle control is shown. *P<0.05 versus vehicle; #P<0.05 versus CHP conditioned medium. (D) Percentage of TRAP-positive MNCs compared with the NanoClik incubated in 50% FBS-conditioned medium using the same protocol as shown in the panel A. The data are shown as the mean ± standard deviation. *P<0.05 versus NanoClik.
Abbreviations: CHP, cholesterol-bearing pullulan; CM, conditioned medium; FBS, fetal bovine serum; M-CSF, macrophage colony-stimulating factor; MNCs, multinucleated cells; NS, not significant; RANKL, nuclear factor kappa B ligand; TRAP, tartrate-resistant acid phosphatase.
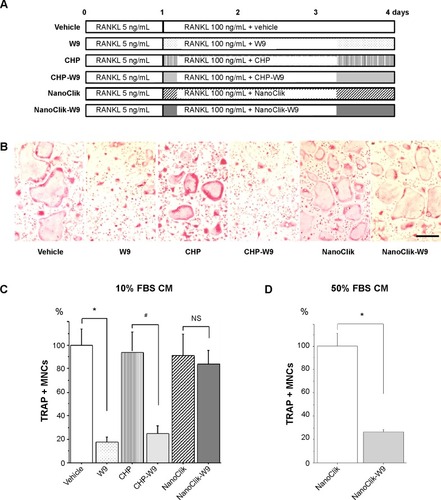
Figure 8 Time-dependent release profile of W9 from NanoClik nanoparticles.
Notes: (A) Schematic diagram of the in vitro experimental protocol to show the release profile of W9 in the 10% culture media. NanoClik-W9 was preincubated in 60 μL of 10% FBS alpha-minimal essential medium for 1 to 5 days before adding to the osteoclast culture at day 1. (B) TRAP-positive MNCs were counted on day 4. Data are shown as the mean ± standard deviation. The numbers shown in the graph indicate the duration of preincubation of NanoClik-W9 in the 10% FBS conditioned medium. (C) Linear regression analysis for the W9 concentrations versus the percentage of TRAP-positive MNCs was performed to predict the released W9 concentration from the inhibition rate of osteoclastogenesis (R2 = 0.955). W9 (1, 3, 5, 10, 30, 50 and 100 μM) was applied to the same culture system as shown in the panel A instead of applying NanoClik-W9. (D) Amounts of W9 released from NanoClik nanoparticles in the culture shown in the panel B were predicted using the linear regression analysis shown in the panel C.
Abbreviations: FBS, fetal bovine serum; MNCs, multinucleated cells; RANKL, nuclear factor kappa B ligand; TRAP, tartrate-resistant acid phosphatase.
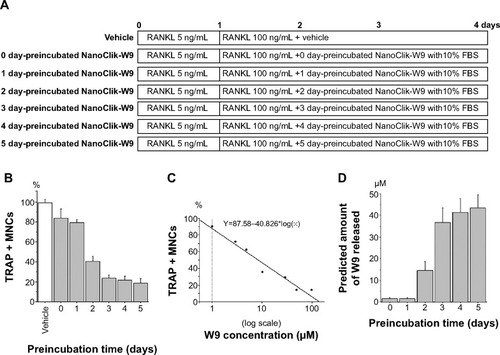
Figure 9 Proposed schema for peptide-drug release from the NanoClik nanoparticles and CHP nanogels.
Notes: The hydrodynamic diameter of W9 incorporated in the NanoClik nanoparticles was larger than that of W9 in the CHP nanogels. After administration of the W9-carrier complex, NanoClik nanoparticles (NanoClik-W9) could sustain the release of W9 better than the CHP nanogels (CHP-W9) due to their decreased degradation. The red circle represents W9, the green line shows PEGSH, and CHP (upper panel) and CHPOA (lower panel) are shown as spherical forms.
Abbreviations: Ca, calcium; CHP, cholesterol-bearing pullulan; CHPOA, acryloyl group-modified cholesterol-bearing pullulan; PEGSH, pentaerythritol tetra (mercaptoethyl) polyoxyethylene.
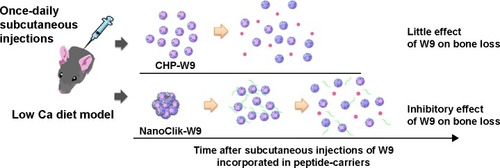
Figure S1 Radiological assessment of distal femurs.
Notes: (A) Three-dimensional reconstruction images of distal femurs examined by microfocal computed tomography. Top, an axial view of transverse bone segments at the metaphysis; bottom, the longitudinal view. The bar represents 1 mm. (B) Results of a quantitative analysis of femoral trabecular BMD at the distal metaphysis measured by peripheral quantitative computed tomography. Data are shown as the mean ± standard deviation, with n=5 for each experimental group. *P<0.05 versus normal Ca + NanoClik; #P<0.05 versus low Ca + NanoClik.
Abbreviations: BMD, bone mineral density; Ca, calcium; CHP, cholesterol-bearing pullulan; Normal Ca + NanoClik (n=5), vehicle (NanoClik nanoparticle)-injected mice fed a normal calcium diet; low Ca + NanoClik (n=5), vehicle (NanoClik nanoparticle)-injected mice fed a low calcium diet; low Ca + W9 (24 mg, n=5), W9 (24 mg/kg/day) was injected into mice fed a low calcium diet; low Ca + CHP-W9 (24 mg, n=5), W9 (24 mg/kg/day) incorporated in CHP nanogels was injected into mice fed a low calcium diet; low Ca + NanoClik-W9 (8 mg, n=5), W9 (8 mg/kg/day) incorporated in NanoClik nanoparticles was injected into mice fed a low calcium diet; low Ca + NanoClik-W9 (24 mg, n=5), W9 (24 mg/kg/day) incorporated in NanoClik nanoparticles was injected into mice fed a low calcium diet.
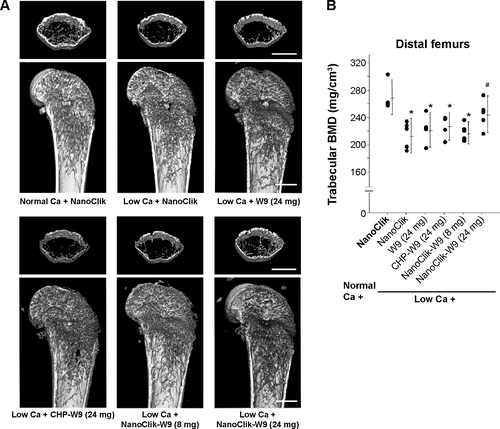
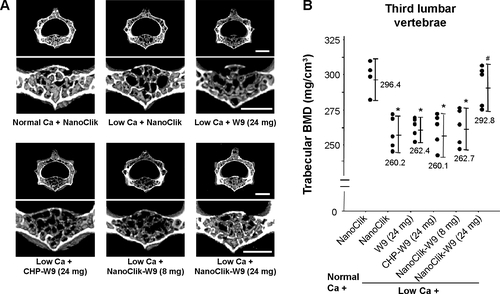
Figure S2 Radiological assessments of the third lumbar vertebrae.
Notes: (A) Three-dimensional reconstruction images (upper panel) and trabecular-rich region (lower panel) of the third lumbar vertebrae were examined by microfocal computed tomography. The bar represents 1 mm. (B) Results of a quantitative analysis of trabecular BMD at the vertebral body measured by peripheral quantitative computed tomography. The data are shown as the mean ± standard deviation with n=5 for each experimental group. *P<0.05 versus normal Ca + NanoClik; #P<0.05 versus low Ca + NanoClik.
Abbreviations: BMD, bone mineral density; Ca, calcium; CHP, cholesterol-bearing pullulan; Normal Ca + NanoClik (n=5), vehicle (NanoClik nanoparticle)-injected mice fed a normal calcium diet; low Ca + NanoClik (n=5), vehicle (NanoClik nanoparticle)-injected mice fed a low calcium diet; low Ca + W9 (24 mg, n=5), W9 (24 mg/kg/day) was injected into mice fed a low calcium diet; low Ca + CHP-W9 (24 mg, n=5), W9 (24 mg/kg/day) incorporated in CHP nanogels was injected into mice fed a low calcium diet; low Ca + NanoClik-W9 (8 mg, n=5), W9 (8 mg/kg/day) incorporated in NanoClik nanoparticles was injected into mice fed a low calcium diet; low Ca + NanoClik-W9 (24 mg, n=5), W9 (24 mg/kg/day) incorporated in NanoClik nanoparticles was injected into mice fed a low calcium diet.