Figures & data
Table 1 Results of a search of US databases (as indicated in the first row), using the term “nanoparticle” in combination with other terms (as indicated in the first column)
Table 2 Clinical trials identified using search terms from
Figure 1 Characterization of ferumoxytol nanoparticles.
Notes: (A) X-ray diffraction patterns of ferumoxytol iron oxide nanoparticles, (B) TEM of ferumoxytol cores. Reprinted from Elsevier and European Journal of Pharmaceutics and Biopharmaceutics, 78(3), Jahn MR, Andreasen HB, Futterer S, et al, A comparative study of the physicochemical properties of iron isomaltoside 1000 (Monofer®), a new intravenous iron preparation and its clinical implications, 480–491, Copyright 2011, with permission from Elsevier.Citation29
Abbreviation: TEM, transmission electron microscopy.
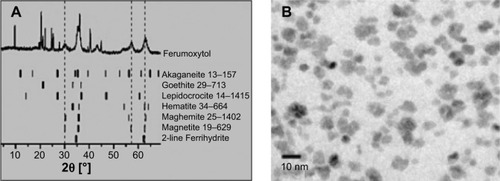
Figure 2 Axial MR imaging of the submandibular node of healthy volunteers after 36 h intravenous administration of Ferumoxtran-10 at a dose of 2.6 mg Fe/kg.
Notes: (A) MR imaging without contrast agent and (B) enhanced contrast in node using Ferumoxtran-10 nanoparticles. Arrow in panel A indicates node which is difficult to visualize because it is nearly as intense as fat. Arrow in panel B shows excellent contrast between the enhanced left submandibular node and the subcutaneous fat. Republished with permission of AJNR Am J Neuroradiol, from Ferumoxtran-10, a superparamagnetic iron oxide as a magnetic resonance enhancement agent for imaging lymph nodes: a phase 2 dose study, Hudgins PA, Anzai Y, Morris MR, Lucas MA, 23(4):649–656, 2002, permission conveyed through Copyright Clearance Center, Inc.Citation32
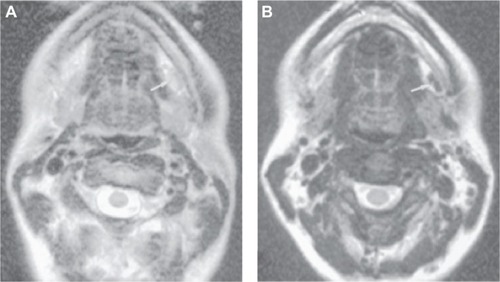
Figure 3 Illustration of SQUID-relaxometry device to detect SPIONs attached to leukemia cells.
Notes: (A) Description of the magnetic needle used to acquire samples in leukemia patients, (B) Representation of the sample magnetization and data acquisition by SQUID-relaxometry. Reprinted from Elsevier and Journal of Magnetism and Magnetic Materials, 321(10), Adolphi NL, Huber DL, Bryant HC, et al, Characterization of magnetite nanoparticles for SQUID-relaxometry, 1459–1464, Copyright 2009, with permission from Elsevier.Citation39
Abbreviations: SPIONs, superparamagnetic iron oxide nanoparticles; SQUID, superconductive quantum interference device.
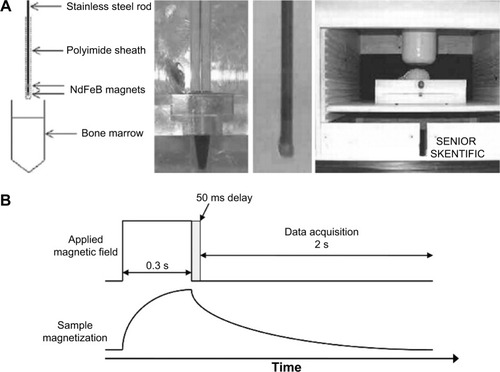
Figure 4 Schematic representation of synthesis of silica–gold nanoparticles.
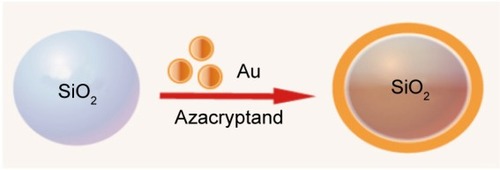
Figure 5 Schematic representation of the radio enhancement mechanism of NBTXR3 nanoparticles in cancer cells after an intratumoral injection.
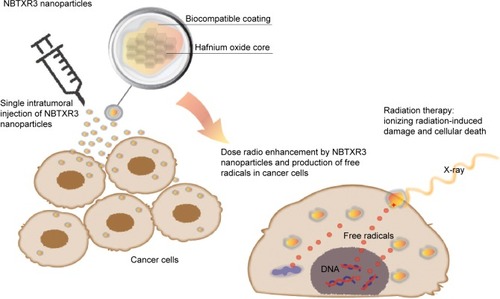
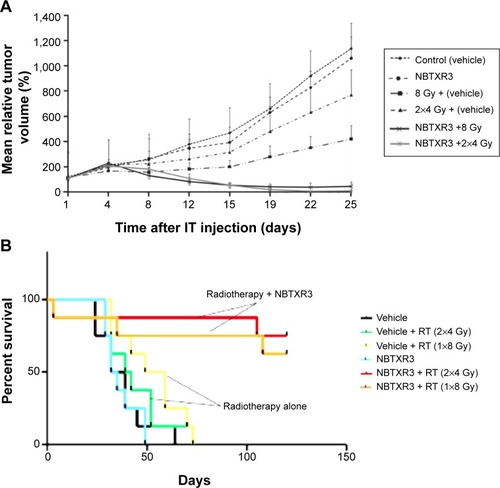
Figure 6 Antitumor activity of NBTXR3 nanoparticles.
Notes: (A) Tumor regrowth delay in an HCT 116 epithelial model after NBTXR3 nanoparticle activation. (B) Kaplan–Meier curves showing the survival rate of Swiss-mice nude mice after nanoparticle treatment. Copyright © 2012. Reproduced from Maggiorella L, Barouch G, Devaux C, et al. Nanoscale radiotherapy with hafnium oxide nanoparticles. Future Oncol. 2012;8(9):1167–1181.Citation56
Abbreviations: IT, intratumoral; RT, radiotherapy; HCT, Human Colorectal Tumor cell line.