Figures & data
Figure 1 Fluorescence data of C60(OH)24 in aqueous media. A) Fluorescence emission spectra of C60(OH)24 after 5 min incubation in water, with excitation at 420 nm. B) Plot of fluorescence intensity versus [C60(OH)24], with excitation at 420 nm; average standard error, 3.76%.
![Figure 1 Fluorescence data of C60(OH)24 in aqueous media. A) Fluorescence emission spectra of C60(OH)24 after 5 min incubation in water, with excitation at 420 nm. B) Plot of fluorescence intensity versus [C60(OH)24], with excitation at 420 nm; average standard error, 3.76%.](/cms/asset/3bd3afb7-9d24-42df-b31f-35c16a1a5169/dijn_a_6630_f0001_b.jpg)
Figure 2 Fluorescence emission spectra of fullerenol (- - -) and dsDNA (——) for different excitation wavelength. A) λ = 420 nm. B) λ = 380 nm. C) λ = 360 nm. D) λ = 340 nm. [C60(OH)24] = 1 × 10⁻⁴ molL−1; [DNA] = 1 × 10⁻⁴ molL−1.
![Figure 2 Fluorescence emission spectra of fullerenol (- - -) and dsDNA (——) for different excitation wavelength. A) λ = 420 nm. B) λ = 380 nm. C) λ = 360 nm. D) λ = 340 nm. [C60(OH)24] = 1 × 10⁻⁴ molL−1; [DNA] = 1 × 10⁻⁴ molL−1.](/cms/asset/8f8cbed8-6cdb-4133-9c2c-cbb10f01fed8/dijn_a_6630_f0002_b.jpg)
Figure 3 Fluorescence data of C60(OH)14 in the presence od dsDNA. A) Fluorescence emission spectra of fullerenol (——) in the presence of dsDNA (- - -) with excitation at 420 nm, as a function of fullerenol concentration; [dsDNA] = 6.31 × 10⁻⁵ molL−1. B) Plot for DNA-C60(OH)24 system as a function of fullerenol concentration in the range of 0.94 × 10⁻⁷ to 4.5 × 10⁻⁵ molL−1; [dsDNA] = 6.31 × 10⁻⁵ molL−1; average standard error, 0.17%.
![Figure 3 Fluorescence data of C60(OH)14 in the presence od dsDNA. A) Fluorescence emission spectra of fullerenol (——) in the presence of dsDNA (- - -) with excitation at 420 nm, as a function of fullerenol concentration; [dsDNA] = 6.31 × 10⁻⁵ molL−1. B) Plot for DNA-C60(OH)24 system as a function of fullerenol concentration in the range of 0.94 × 10⁻⁷ to 4.5 × 10⁻⁵ molL−1; [dsDNA] = 6.31 × 10⁻⁵ molL−1; average standard error, 0.17%.](/cms/asset/5e917492-340c-44a4-8e79-c074e8a11078/dijn_a_6630_f0003_b.jpg)
Figure 4 Dependence of fluorescence intensity of C60(OH)24 on dsDNA concentration. A) Fluorescence spectra of fullerenol (– · –) with increasing concentration of DNA (—) with excitation at 420 nm ; B) Plot of fluorescence intensity of fullerenol as a function of [dsDNA] in the concentration range of 1.3 × 10⁻⁹ to 4.4 × 10⁻⁶ molL−1; [C60(OH)24] = 4.5 × 10⁻⁵ molL−1; average standard errors: 2.69% for 2.5E−5−5E−5 region and 10.80% for 1.3E−9−3.1E−6 region.
![Figure 4 Dependence of fluorescence intensity of C60(OH)24 on dsDNA concentration. A) Fluorescence spectra of fullerenol (– · –) with increasing concentration of DNA (—) with excitation at 420 nm ; B) Plot of fluorescence intensity of fullerenol as a function of [dsDNA] in the concentration range of 1.3 × 10⁻⁹ to 4.4 × 10⁻⁶ molL−1; [C60(OH)24] = 4.5 × 10⁻⁵ molL−1; average standard errors: 2.69% for 2.5E−5−5E−5 region and 10.80% for 1.3E−9−3.1E−6 region.](/cms/asset/b610f832-14bc-4e7b-a015-06b2cc27eb97/dijn_a_6630_f0004_b.jpg)
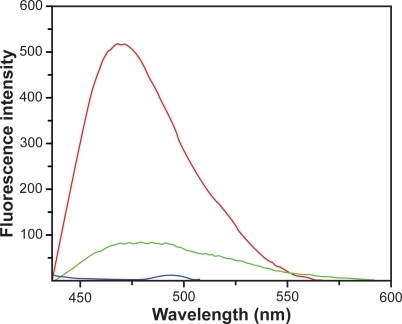
Figure 5 Emission spectra of C60(OH)24 (red line), DNA-sodium salt (blue line) and C60(OH)24 − DNA-sodium salt complex (green) line.
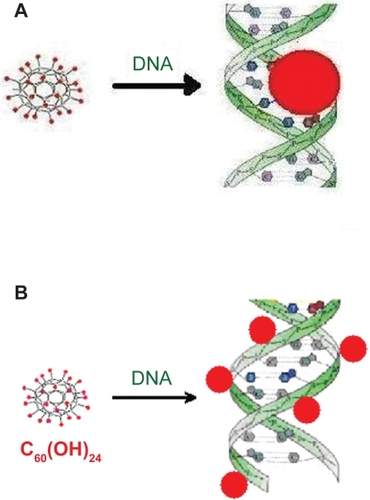
Scheme 1 Binding fullerenol C60(OH)24 to dsDNA. A) Binding fullerenol to the major groove of sodium salt of dsDNA. B) Binding fullerenol to the outside of the dsDNA.