Figures & data
Figure 1 (A) The illustration of synthetic routine of carboxyl-functionalized triblock copolymer F127 (F127COOH). (B) The efavirenz-loaded F127COOH micelles bioconjugated with antibody.
Abbreviations: EO, ethylene oxide; PEO, polyethylene oxide; PO, propylene oxide; PPO, polypropylene oxide.
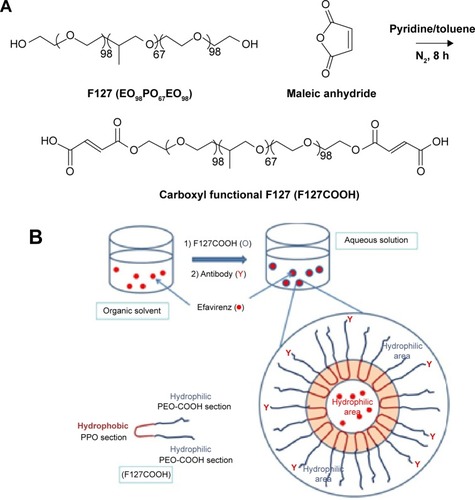
Figure 2 (A) TEM and (B) DLS of the formulation.
Notes: (A) Presents the representative particle shape and size of F127COOH-EFV nanodrug around 120–140 nm using the TEM technique, which shows excellent monodispersion directly. (B) Displays the hydrodynamic radius of F127COOH-EFV nanodrug particles in the aqueous solution about 130 nm using the DLS technique with small size distribution index (PDI) as 0.10. The hydrodynamic size in aqueous dispersion by the method of DLS has high consistency with the TEM results.
Abbreviations: DLS, dynamic laser scattering; EFV, efavirenz; PDI, polydispersion index; TEM, transmission electron microscopy.
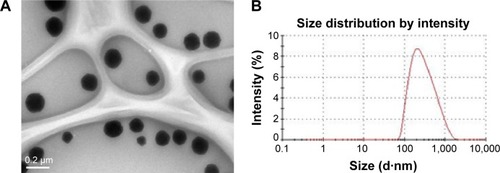
Figure 3 Stability characterization of nanoformulation: (A) pH 7.4 PBS and (B) 0.005% pepsin solution.
Notes: (A) DLS hydrodynamic size against time indicated the long-term stability of nanodrug in aqueous solution. Both of them showed size fluctuation <10%. Hydrodynamic diameter of F127COOH-EFV presented size fluctuation <10%, indicating the long-term well colloidal stability in a physiological condition (pH 7.4). (B) One week incubation with 0.005% pepsin solution showed the stability of nanoformulation under intestine enzymatic circumstance.
Abbreviations: DLS, dynamic laser scattering; EFV, efavirenz; PBS, phosphate-buffered saline.
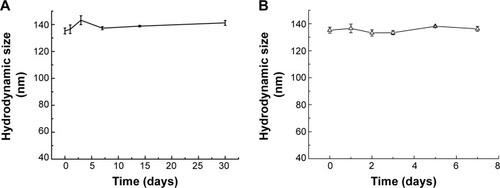
Figure 4 Dissolution study of nanodrug in PBS in in vitro model.
Notes: Dispersion of the micelles in PBS (pH 7.4) placed in the dialysis bag and dialyzed against the respective buffer solution at 37°C. The released drug outside of dialysis bag was sampled at different time intervals (from 5 minutes up to 14 days) and measured by HPLC. The data were expressed as 80% of drug released from the Pluronics relative to the initial drug loading.
Abbreviations: HPLC, high-performance liquid chromatography; PBS, phosphate-buffered saline.
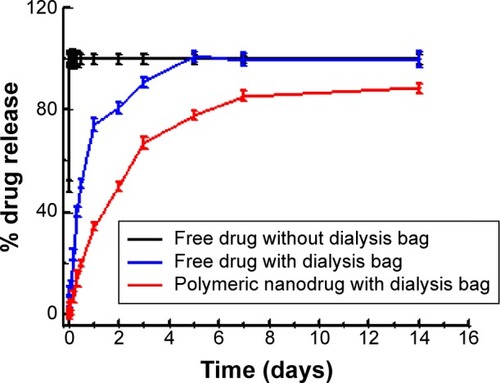
Figure 5 Cytotoxicity of nanodrug on Caco-2 cells and primary human macrophages.
Notes: (A) Caco-2 cells were exposed to 0.1–10 mg/mL concentration of nanodrug for 24 hours. (B) Primary human macrophages were exposed to 1–100 µg/mL concentration of nanodrug for 24 hours. After incubation, MTS assay was performed and optical density of culture supernatant was measured at 490 nm. Data were presented as % survival of cells at different concentrations of nanodrug. Untreated cells were considered as control (0) with 100% viability. The changes in viability at different concentrations of nanodrug compared to control were found to be nonsignificant.
Abbreviation: MTS, 3-(4,5-dimethylthiazol-2-yl)-5-(3-carboxymethoxyphenyl)-2-(4-sulfophenyl)-2H-tetrazolium.
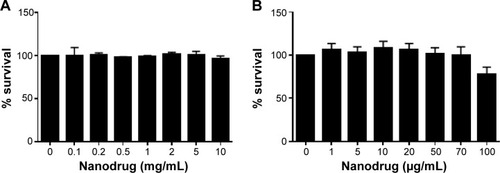
Figure 6 Effect of nanodrug on ROS production in Caco-2 cells.
Notes: Cells were exposed to 0.1–10 mg/mL concentration of nanodrug for 24 hours. At the end of incubation, ROS assay was performed. The fluorescence was detected at 485 nm excitation and at 528 nm emission spectra. Catalase was used as antioxidant control, and H2O2 was used as positive control. Data are expressed as mean ± SE of RFU values of four independent experiments. A value of P<0.0001 was indicative of significance (****). There was no statistical significance between treated groups and control.
Abbreviations: ROS, reactive oxygen species; RFU, relative fluorescence unit; SE, standard error.
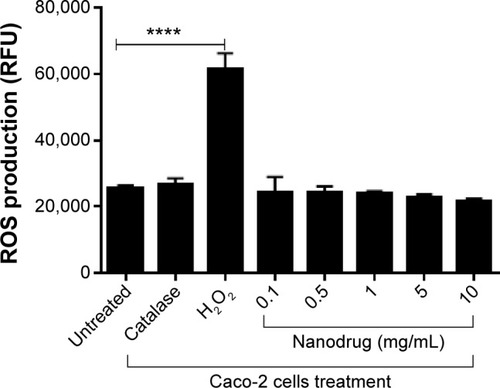
Figure 7 Flow cytometric analysis of M-cell-like characteristics in Caco-2 and Raji cell co-culture systems.
Notes: Caco-2, Raji, and Caco-2 + Raji cells were cultured simultaneously and stained with anti-GP2 antibody at the end of incubation. Cells were gated for GP2, based on the isotype in the respective cells.
Abbreviations: FITC, fluorescein isothiocyanate; GP2, glycoprotein 2.
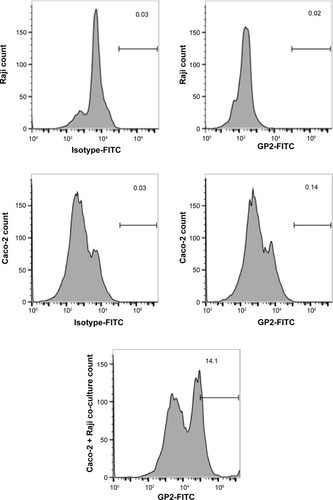
Figure 8 Immunocytochemical analysis of M-cell characters in Caco-2 and Raji co-culture.
Notes: Cells were exposed to anti-GP2 antibody after differentiation process and stained with fluorescent secondary antibody. Microscopic images were taken through Axio Imager 2. DAPI (in blue) indicated the cell nucleus, and the cells those have developed M-cell-like characteristics were stained with GP2 antibody (green).
Abbreviations: DAPI, 4′,6-diamidino-2-phenylindole; GP2, glycoprotein 2.
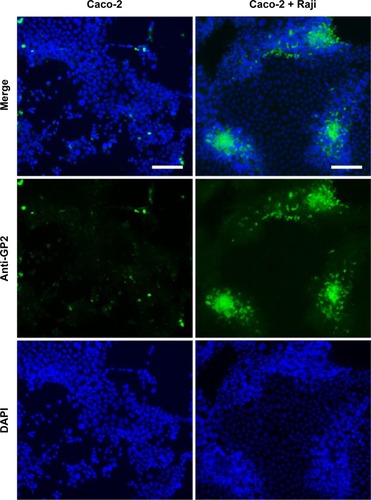
Figure 9 Uptake and release of fluorescent dye (Alexa Fluor 610X NHS ester) labeled nanodrug (FND) by M-cells.
Notes: (A) Uptake of anti-GP2-conjugated nanodrug by M-cells within 2 hours of incubation. Caco-2 and M-cells were treated with and without antibody (GP2) tagged with FND. The treatments were as follows (from left to right): (1) Caco-2 cells treated with FND; (2) Caco-2 cells treated with FND + GP2; (3) M-cells treated with only FND; and (4) M-cells treated with FND + GP2. Cells were stained with DAPI in order to observe the localization of FND and are represented in the following order: (a) FND; (b) DAPI; and (c) FND and DAPI merged (scale bar 50 µm). Co-localization of FND on the cell surface is shown as a magnified image in (I), (II), and (III) of A (scale bar =20 µm). (B) Release of FND in vitro Transwell co-culture model at lower chamber. Drug release was observed with respect to fluorescence measurement. Fluorescent drug release was significantly sustained in M-cells than Caco-2 cells (P<0.0015).
Abbreviations: DAPI, 4′,6-diamidino-2-phenylindole; FND, fluorescent nanodrug; GP2, glycoprotein 2; NHS, N-hydroxysuccinimide.
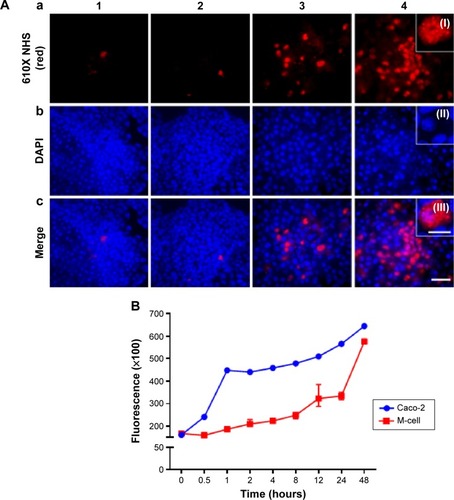
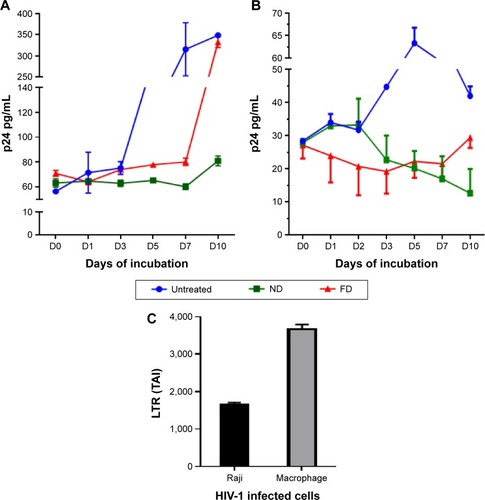
Figure 10 Comparative analysis of anti-HIV activity of nanodrug vs unformulated EFV on macrophages and M-cells.
Notes: (A) Effect of nanodrug on HIV-infected macrophages compared to EFV. (B) Effect of nanodrug or EFV was observed on HIV replication in M-cell culture model. HIV replication was monitored with respect to p24 protein level in the culture supernatant at different times (days). The data represented with respect to p24 level vs time (days) in untreated, nanodrug-treated (ND, in green), and EFV drug-treated (FD, in red) M-cells exposed to HIV (P=0.001). Untreated and HIV-infected macrophage/Raji cells were treated as positive control (in blue). Statistical significance was calculated with respect to P-values (P=0.001). (C) HIV-LTR-R/U5 gene expression was done through PCR. The two columns show HIV infection in the Raji (black) and macrophage (gray) cells after 10 days of incubation. The LTR gene expressions in both cells were expressed in TAI and normalized with housekeeping gene GAPDH.
Abbreviations: D, day; EFV, efavirenz; HIV, human immunodeficiency virus; LTR, long terminal repeat; PCR, polymerase chain reaction; TAI, transcript accumulation index.