Figures & data
Figure 1 Three-dimensional molecular representation of the modeled MWCNT–FITC structure used in 1,000 ps molecular dynamics simulation in vacuo.
Notes: Frontal (A) and transverse (B) views. The molecule is rendered as ball-and-stick and coloured according to atom type without hydrogens to enhance clarity.
Abbreviations: CNT, carbon nanotube; MWCNT–FITC, multiwalled carbon nanotube functionalized with fluorescein isothiocyanate.
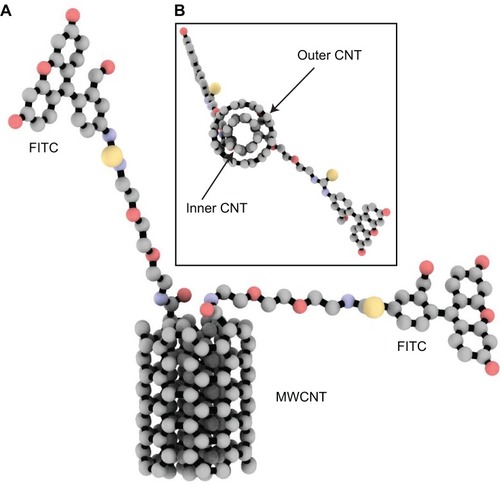
Figure 2 TER measurements of the cEND monolayers and the BBB transport studies of MWCNT–FITC and FITC–dextran.
Notes: Continuous recording of transendothelial electric resistance of the cEND monolayers seeded on collagen type 4-coated PET membranes in order to assess cell tightness after 2, 24, and 48 hours of MWCNT–FITC or FITC–dextran treatment (A). The BBB in vitro transport study of MWCNT–FITC (B) and FITC–dextran (C) for estimation of permeation rate. The fluorescence is measured in arbitrary units, abbreviated as au. Data represent means ± SD of three independent experiments.
Abbreviations: cEND, cerebral endothelial; PET, polyethylene terephthalate; MWCNT–FITC, multiwalled carbon nanotube functionalized with fluorescein isothiocyanate; FITC, fluorescein isothiocyanate; BBB, blood–brain barrier; TER, transendothelial electric resistance; SD, standard deviation; h, hours.
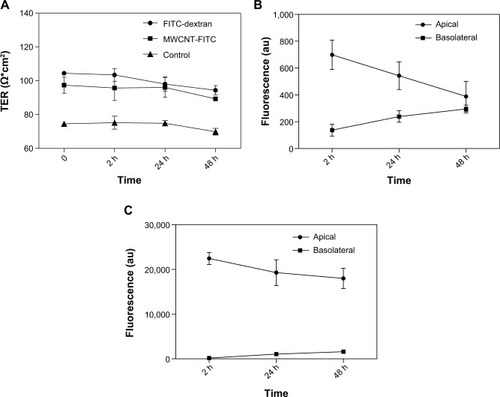
Figure 3 Western blot analysis of tight junction-related proteins expressed in cEND cells was performed using antibodies against occludin, claudin-5, and β-actin (internal/loading control).
Notes: Expression profiles of tight junction-related proteins (occludin and claudin-5) in untreated (control) and MWCNT–FITC-treated cEND cells (A). Immunoblots analyzed and proteins quantified with the ImageJ software (B). The area is measured in arbitrary units, abbreviated as au. Data represent means ± SD of three independent experiments.
Abbreviations: MWCNT–FITC, multiwalled carbon nanotube functionalized with fluorescein isothiocyanate; cEND, cerebral endothelial; SD, standard deviation.
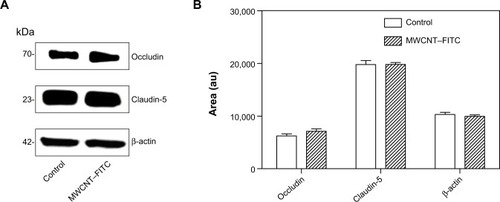
Figure 4 cEND cell viability to measure MWCNT–FITC toxic effect over time.
Notes: Cell viability was assessed by the amount of ATP produced by metabolically active cells. The released ATP converts luciferin substrate to luciferin oxide, and released luminescence signals were recorded. The luminescence is measured in percentage to a control group (untreated cells). 10% solution of DMSO was used as positive control. The thresholds are depicted as dashed lines. Data represent means ± SD of three independent experiments.
Abbreviations: cEND, cerebral endothelial; MWCNT–FITC, multiwalled carbon nanotube functionalized with fluorescein isothiocyanate; ATP, adenosine triphosphate; DMSO, dimethyl sulfoxide; TD50, median toxic dose level; SD, standard deviation; h, hours.
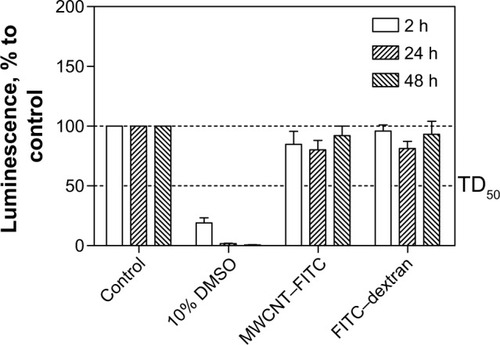
Figure 5 Fluorescent and phase-contrast microscopy with image analysis of the cEND cell monolayers treated with FITC-conjugated MWCNTs.
Notes: Low (A) and high (a) magnification (scale bar =25 μm) fluorescent microscopic images together with conventional light (phase-contrast) (B) microscopy are shown for the cEND cell monolayers treated with FITC-conjugated MWCNTs, which were accumulated in cells (shown with arrows). Pseudo-colour fluorescent image (C) and correlation plot (D) to identify the amount of signal colocalization and intensity distribution. Cells are blue, nanotube aggregates are red, and colocalized spots are white.
Abbreviations: cEND, cerebral endothelial; FITC, fluorescein isothiocyanate; MWCNT, multiwalled carbon nanotube.
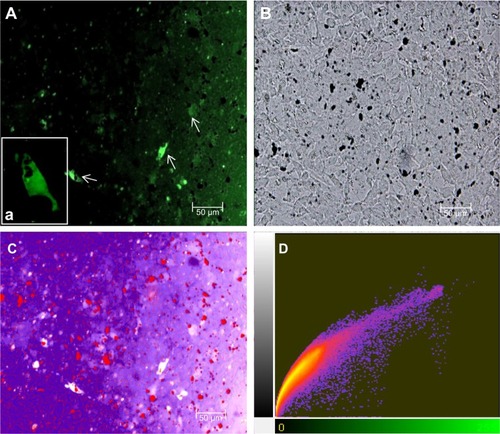
Table 1 Summary of main geometric properties for different MWCNT–FITC aggregation types (I–IV) from the in vitro BBB transport study
Table 2 Summary of average geometric characteristics for different MWCNT–FITC aggregation types (I–IV) from the in vitro BBB transport study
Figure 6 Three-dimensional mesh intensity plot of the bulky MWCNT–FITC aggregates (red) on PET membrane covered with confluent cEND cells (blue).
Abbreviations: cEND, cerebral endothelial; MWCNT–FITC, multiwalled carbon nanotube functionalized with fluorescein isothiocyanate.
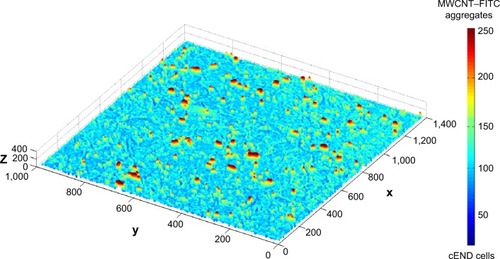
Table 3 Summary of VDW aggregation energy for different carbon nanotube aggregates determined from 1,000 ps molecular dynamics study of MWCNT–FITC
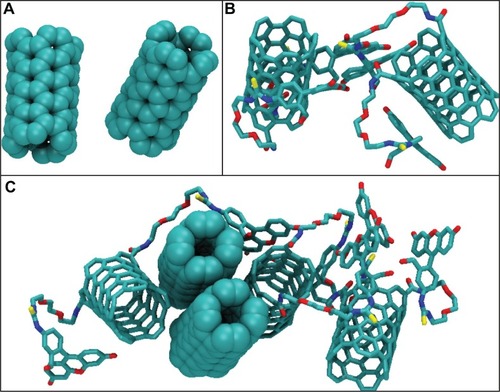
Figure 7 All-atom molecular dynamics simulation of MWCNT–FITC structures in vacuo.
Notes: Visualization of the carbon nanotube aggregates determined from 1,000 ps molecular dynamics simulation of MWCNT–FITC: the SWCNT (A) and SWCNT–FITC (B) dimers, and SWCNT/SWCNT–FITC hybrid pentamer (C). These nanotube aggregates are represented as space-filling diagram and licorice models coloured according to their atomic composition. Hydrogen atoms are omitted for clarity.
Abbreviations: MWCNT–FITC, multiwalled carbon nanotube functionalized with fluorescein isothiocyanate; SWCNT, single-walled carbon nanotube; SWCNT–FITC, single-walled carbon nanotube functionalized with fluorescein isothiocyanate.