Figures & data
Figure 1 Synthesis of biotin derivatives used in assembly of ANANAS-red681.
Abbreviations: ANANAS, avidin-nucleic acid nanoassembly; DMSO, dimethyl sulfoxide; TEA, triethylamine; RT, room temperature; NHS, N-hydroxysuccinimide; PEG: poly(ethylene glycol).
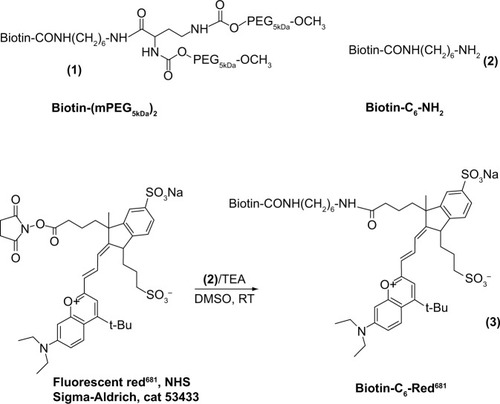
Figure 2 Confocal laser endomicroscopic images of healthy and chronically inflamed mucosa in the green and red channels.
Notes: The images were obtained after intravenous administration of fluorescein at different concentrations (10%, 1.0%, and 0.1% w/v). Each image represents one example of three per group of animals per condition. The images obtained in the green channel (A1–A3 and B1–B3) show the hexagonal honeycomb appearance of the mucosa. Nonideal fluorescein concentrations yield either overexposed images (10%, A1 and B1) or loss of details (0.1%, A3 and B3). Normal mucosa shows a network of capillaries surrounding the crypt openings with a honeycomb appearance. In inflamed mucosa, the crypt lumen is large and variably shaped, with fluorescein leakage into the crypt openings (arrows in B2). In the red channel (A4–A6 and B4–B6), any visible structure (A4 and B4) is due to fluorescein-related signal cross-over.
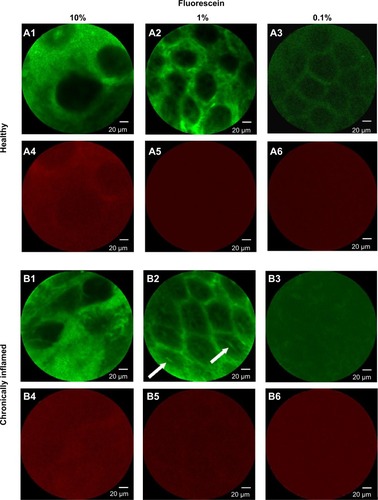
Figure 3 Differential nanoparticle distribution in inflamed and healthy mucosa.
Notes: Selected images of healthy (A) (n=3) and chronically inflamed (B) (n=3) mouse mucosa, upon intravenous administration of ANANAS-red681 in phosphate-buffered saline containing 1% fluorescein. CLE images were acquired in the green (A1, B1, B4) and red (A2, B2, B5) channels. Merged red and green images are shown in panels A3, B3, and B6. The yellow color corresponds to the merged signal from green and red channels.
Abbreviations: ANANAS, avidin-nucleic acid nanoassembly; CLE, confocal laser endomicroscopy.
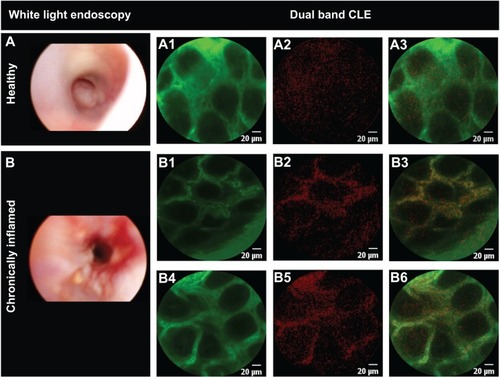
Figure S1 Chromatographic analysis of red681 derivatives. (A) Starting NHS reagent, (B) biotin-C -red681 derivative (compound 3), and (C) compound 3 in the presence of avidin.
Notes: Analyses were carried out using fast protein liquid chromatography apparatus (Akta Purifier, GE Healthcare, Little Chalfont, UK) equipped with a Superdex peptide column and eluted with 10 mM phosphate, 150 mM NaCl, pH7.4 (phosphate-buffered saline) at 0.5 mL/min. Chromatograms were registered at 681 nm.
Abbreviations: ANANAS, avidin-nucleic acid nanoassembly; NHS, N-hydroxysuccinimide.
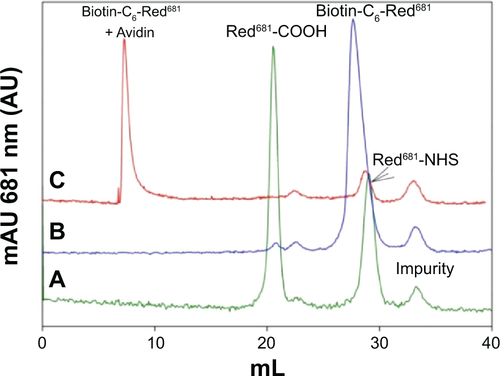
Figure S2 Fluorescence intensity versus concentration of red681-COOH (•) and biotin-C6-red681 as before (▲), and in the presence of avidin (□).
Abbreviation: RIU, relative intensity units.
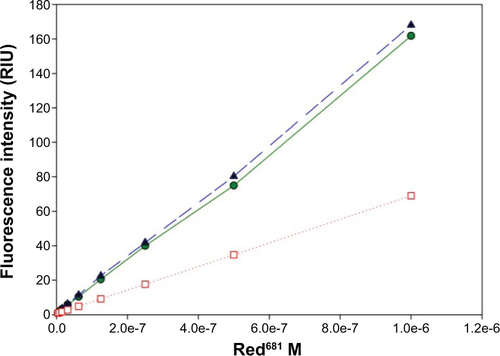
Figure S3 (A) Intensity and (B) volume weighted size distribution of ANANAS assembly prepared for this work, as determined by dynamic light scattering.
Abbreviation: ANANAS, avidin-nucleic acid nanoassembly.
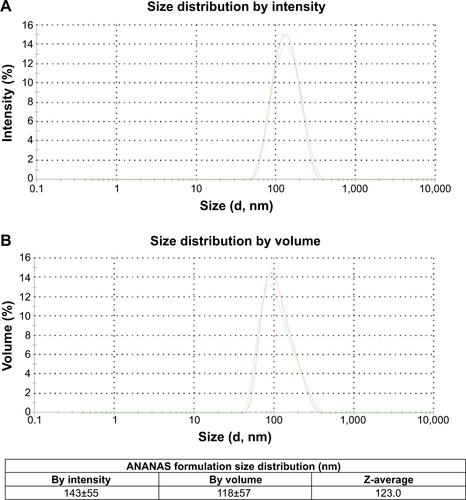
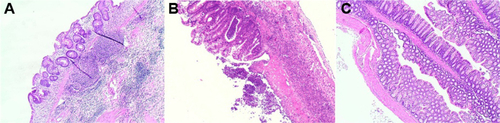
Figure S4 Histology images of dextran sodium sulfate-treated (A, B) and healthy (C) mouse colonic mucosa.
Notes: Colonic segments, fixed in 4% formaldehyde, were stained with hematoxylin and eosin and reviewed by a pathologist in a blinded fashion. Original magnification for histology, 40×.