Figures & data
Figure 1 (A) Synthesis strategy of the co-polymer poly(ethyleneglycol-b-trimethylsilyl methacrylate); (B) synthesis strategy of tBuBipyGd complex; and (C) encapsulation of contrast agent during the self-assembly of polymeric nanoparticles (micelles).
Abbreviations: THF, tetrahydrofuran; h, hour; AIBN, azobisisobutyronitrile; DMSO, dimethyl sulfoxyde.
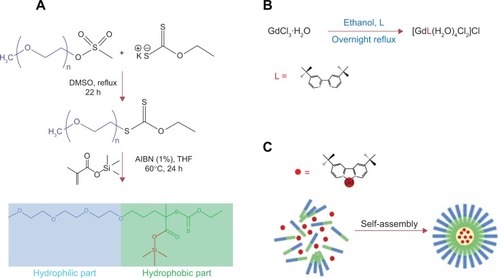
Figure 2 Relationship between the absorbance intensity and concentration of tBuBipyGd complex and 1-methylpyrene at the optimum wavelength.
Notes: (A) Absorbance of tBuBipyGd complex at 282 nm. (B) Absorbance of 1-methylpyrene at 344 nm.
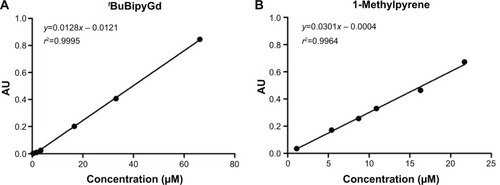
Figure 3 (A) Dynamic light-scattering results for loaded polymeric micelles after the encapsulation of the contrast agent. (B) TEM of contrast-loaded polymeric micelles after the self-assembly of poly(ethylene glycol-b-trimethylsilyl methacrylate).
Note: Magnification: ×200,000. Bar scale: 50 nm.
Abbreviation: TEM, transmission electron microscopy.
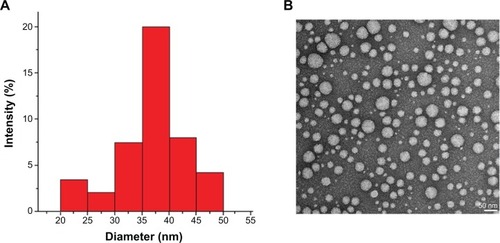
Figure 4 1-Methylpyrene (MePy) fluorophore-loaded polymeric micelle stability in water and cell culture medium.
Notes: Fluorescence intensity spectra of 1-methylpyrene monomer (375 nm) and excimer (480 nm) was measured to detect disintegrated and intact micelles, respectively, and these were found to be stable in (A) water and (B) culture medium. (C) Micelle bioconjugation with the SM3 MUC1 monoclonal antibody did not alter stability in culture medium.
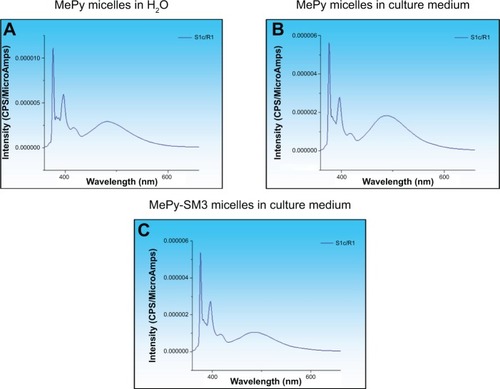
Figure 5 (A) Scheme of 1H NMR relaxometric experiment to measure T1 of water before and after the release of the contrast agent from the polymeric micelles. (B) Magnetic resonance image of microfuge tubes containing tBuBipyGd complex–loaded micelles, at pH 7 (square a) and at pH 5.5 (square b).
Abbreviation: NMR, nuclear magnetic resonance.
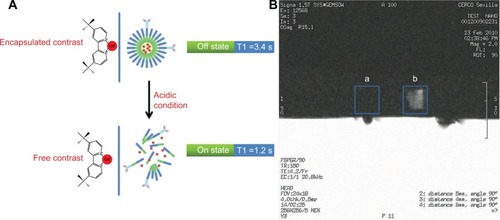
Figure 6 Encapsulation of Gd(III) complex in polymeric micelles prevents cytotoxicity.
Notes: (A) A linear regression line was calculated from data obtained by MTT assay, to obtain the LD50 of tBuBipyGd complex for MCF-7 and Jurkat cell lines. (B) Comparison of cytotoxicity of low (10 μM) and high (50 μM) concentrations of free and micelle-encapsulated tBuBipyGd complex using MTT assay on the Jurkat cell line, after 3 days of incubation. Data represent the means of quadruplicate + standard error of the mean (***P≤0.0001, unpaired t-test).
Abbreviation: MTT, 3-(4,5-dimethylthiazol-2-yl)-2,5-diphenyl tetrazolium bromide; LD50, median lethal dose.
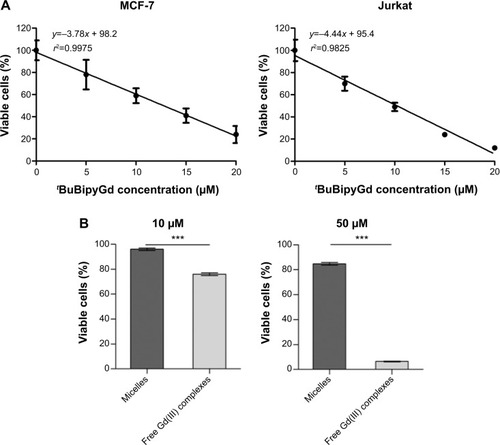
Figure 7 (A) Detection of MUC1 mRNA expression in different cell lines by quantitative RT-PCR analysis. (B) Detection of MUC1 cell surface expression on MCF-7 and MDA-MB-468 cell lines by fluorescent flow cytometry using the C595 (green line) and SM3 (pink line) mAbs.
Note: The dark blue shaded region corresponds to the signal obtained with a control nonspecific isotypic antibody.
Abbreviations: mRNA, messenger RNA; RT-PCR, real-time polymerase chain reaction.
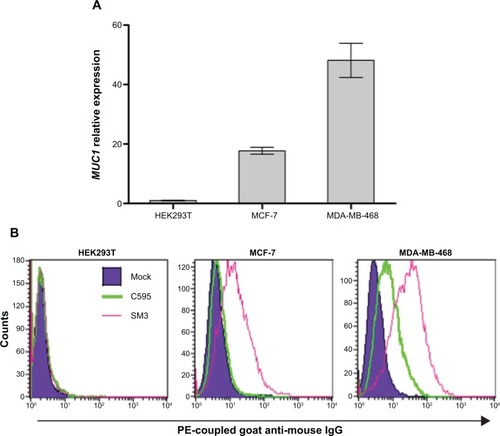
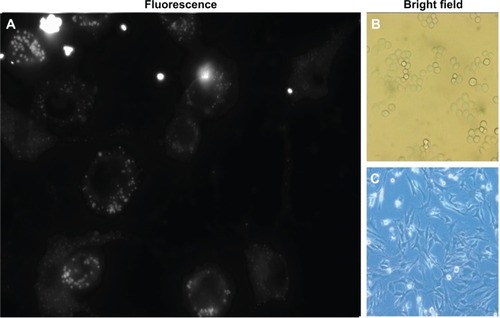
Figure 8 Targeting of anti-MUC1 bioconjugated micelles to breast cancer cell lines.
Notes: (A) Specific binding of C595 anti-MUC1 1-methylpyrene–loaded micelles to MCF-7 breast cancer cells. After washing three times, high 1-methylpyrene fluorescence signal was found in cells incubated with polymeric micelles conjugated with C595 monoclonal antibody, while a low level of background fluorescence was visible in MCF-7 cells incubated with nontargeting micelles. (B) Targeting of C595 and SM3 anti-MUC1 1-methylpyrene–loaded micelles to MDA-MB-468 breast cancer cells.
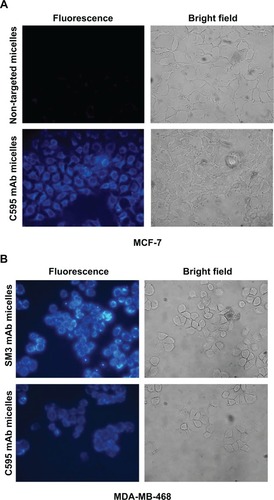
Figure 9 Increased targeting of anti-MUC1 1-methylpyrene–loaded micelles to MDA-MB-468 breast cancer cells.
Notes: (A) MDA-MB-468 and S17 cells cultured together in a 1:5 proportion were incubated for 1 hour with C595 mAb–bioconjugated micelles. (B) Bright field microscopy of MDA-MB-468 cells. (C) Brigth field microscopy of S17 cells.