Figures & data
Table 1 Strains used for testing the effect of MTB binding peptide and the new MTB detection method
Figure 1 Bacteria cells are separated by MMSs coupled with specific peptides or polyclonal antibodies.
Notes: The fluorescent signal of QDs can be detected for imaging. The principle of the assay is based upon the conformation of the ternary complex, composed of bacterial cells, MMSs coupled with H37Rv binding peptides as well as the polyclonal antibodies, and QDs conjugated with H37Rv binding peptides or the monoclonal antibodies. Upon magnetic separation by MMSs, the complexes are tagged with functional QDs for detection of the fluorescent signal.
Abbreviations: MMSs, magnetic microspheres; QDs, quantum dots.
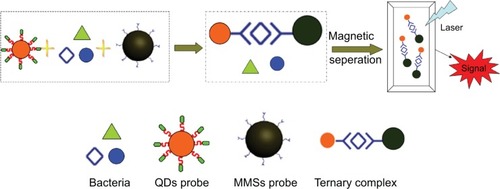
Table 2 Outcomes of phage display biopanning
Figure 2 Kinetics of peptide H8-MTB binding and specificity were investigated and analyzed on the Octet-QK device.
Notes: (A) Kinetics analyses of H8-MTB binding with double diluted H37Rv. Kdis (s−1) was used to evaluate the binding affinity of H8 to H37Rv. Based on the stacked graph, the Kdis value of H8-MTB binding is 3.45E-04±8.50E-06 (R2=0.973). (B) Kinetics analyses of binding affinity of H8 to H37Rv, BCG, P. aeruginosa, and E. coli. The binding specificity of H8 to BCG, P. aeruginosa and E. coli was significantly lower than that to H37Rv.
Abbreviations: BCG, Mycobacterium bovis bacillus Calmette–Guérin; P. aeruginosa, Pseudomonas aeruginosa; E. coli, Escherichia coli.
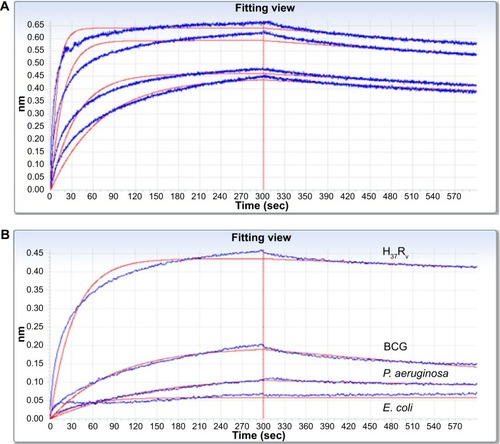
Figure 3 Microscopic observation of H37Rv bacilli, captured by the H8 conjugated MMSs.
Notes: (A) Ziehl–Neelsen stain 1,000× and QDs. (B) direct fluorescence observation 400× and Ziehl–Neelsen stain 1000×.
Abbreviations: MMSs, magnetic microspheres; QDs, quantum dots.
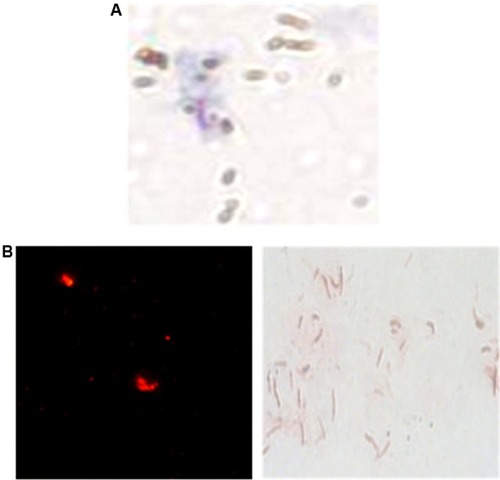
Figure 4 Microscopic observation of the sandwich complex of H37Rv bacterial cells, MMSs, and QDs (direct fluorescence observation 400× and Ziehl–Neelsen stain 1,000×).
Abbreviations: MMSs, magnetic microspheres; QDs, quantum dots.
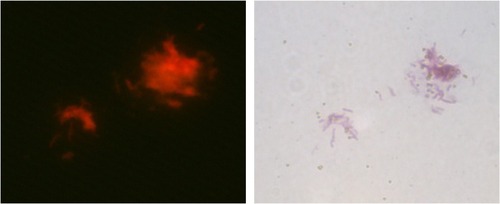
Figure 5 LOD detection for six combinations of MMSs coupled with H8 or Pab and QDs conjugated with H8, Mab, or mabc.
Notes: Differences in MTB detection capability between the combinations were evident for a range of MTB concentrations in the test. Combinations of MMS-H8+QD-mAb and MMS-Pab+QD-mAbc produced a strong signal for only 107 CFU/mL H37Rv cells, indicating relatively poor MTB detection capability. Combinations of MMS-H8+QD-mAbc and MMS-Pab+QD-mAb exhibited a higher but decreasing fluorescence intensity of H37Rv for 105 CFU/mL or 106 CFU/mL, showing improved MTB detection capability. Combinations of MMS-Pab+QD-H8 and MMS-H8+QD-H8 yield a significantly higher signal for 103 CFU/mL H37Rv and thus demonstrated the best MTB detection capability.
Abbreviations: LOD, limit of detection; MMSs, magnetic microspheres; QDs, quantum dots; Pab, a rabbit polyclonal antibody against MTB; mAb, a murine monoclonal antibody against MTB; mAbc, a murine monoclonal antibody against MTB heat shock protein 65 (HSP65); CFU, colony-forming unit; mAbc, .
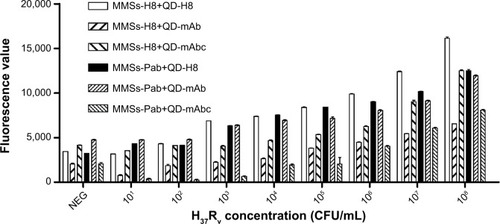
Figure 6 Optimization of the detection concentration of MMS-H8 and QD-H8.
Notes: MMS-H8 and QD-H8 were diluted to 50 mg/L; 100 mg/L; 150 mg/L; and 200 mg/L, respectively. The concentration was optimized for the H37Rv detection. High fluorescence was obtained for 100 mg/L as the best detection concentration for MMSs and QDs.
Abbreviations: MMSs, magnetic microspheres; QDs, quantum dots.
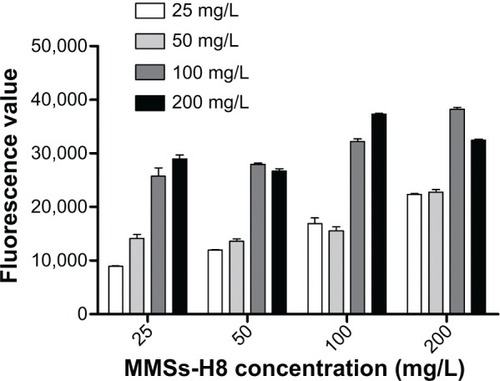
Figure 7 Optimization of the incubation time of bacterial cells, MMS-H8, and QD-H8.
Notes: The incubation time was set at 0.5 h, 1 h, 1.5 h, 2 h, 2.5 h, and 3 h for optimization. Highest fluorescence signal was obtained at 2 h as the optimum interaction time.
Abbreviations: MMSs, magnetic microspheres; QDs, quantum dots; h, hour.
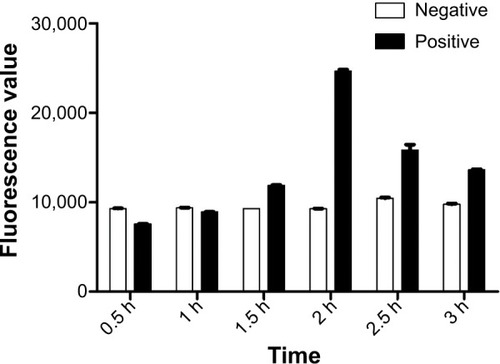
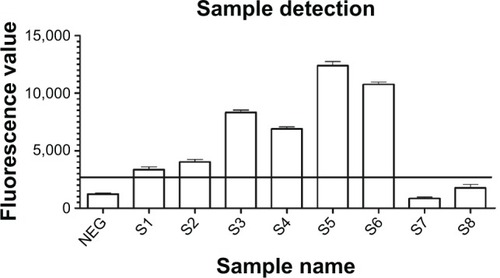
Figure 8 Detection of sputum samples with the new nano detection method.
Notes: Eight sputum samples were collected and detected with direct smear and the new sandwich method simultaneously. Positive results were only obtained for the six smear positive samples (S1–S6), including two one positive (1+) smear samples (S1, S2).