Figures & data
Table 1 Composition of the liquid-crystalline formulations and release constants (K0p and K0q) for formulations F1 and F5 (data are mean ± SEM, n=6)
Figure 1 TEM image of TiO2 nanoparticles obtained by sol-gel process.
Abbreviations: TEM, transmission electron microscopy; TiO2, titanium dioxide.
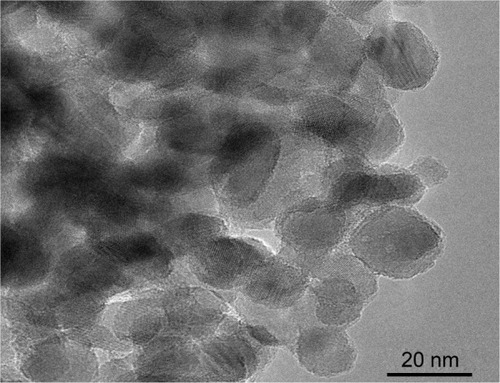
Figure 2 Visible diffuse reflectance spectra of liquid-crystalline formulations containing 15% commercial TiO2 and 30% PTSH-modified TiO2 nanoparticles.
Abbreviations: PTSH, p-toluene sulfonic acid; TiO2, titanium dioxide.
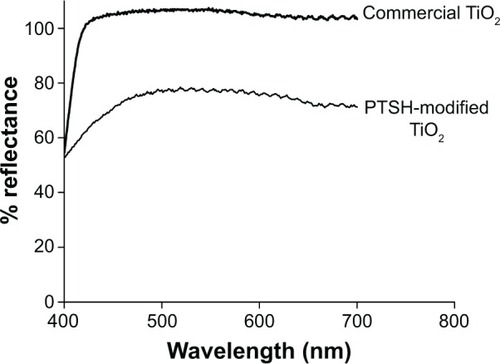
Figure 3 Absorbance spectra of liquid-crystalline formulations with and without TiO2 nanoparticles.
Notes: λc of the formulation containing TiO2 is appointed over the arrow which traces 90% of the area under the spectrum from 290 to 400 nm.
Abbreviations: λc, critical wavelength; TiO2, titanium dioxide.
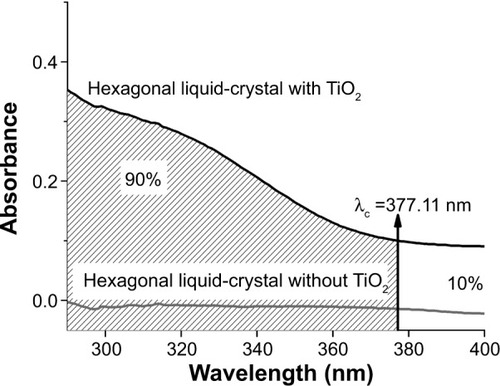
Figure 4 SAXS curves and polarized light micrographs of liquid-crystalline formulations (A) F1 and F5 and (B) F1.
Note: *Appoints the peaks related to the hexagonal phase.
Abbreviations: I(q), scattering intensity; SAXS, small-angle X-ray scattering.
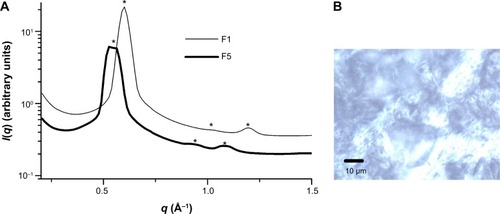
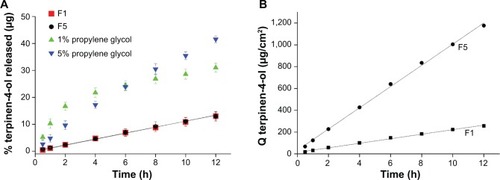
Figure 5 Terpinen-4-ol release profiles of F1 and F5 formulations.
Notes: (A) % (μg) plotted versus time comparing TP (1% and 5%) incorporated in propylene glycol and (B) Q terpinen-4-ol (μg/cm2) plotted versus time (data are mean ± SD, n=6). The lines on both graphs represent the zero-order regression line.
Abbreviations: h, hours; SD, standard deviation; TP, terpinen-4-ol.