Figures & data
Figure 1 Design consideration and components of POCKET Liposomes.
Notes: Various components in the liposomes are shown in cartoon (bottom, right) as indicated. Drug A represents HPPH (red), whereas calcein (green) was used as model Drug B. Photoactivated drug upon laser treatment is shown in right panel of the cartoon (orange). Laser treatment results in activation of HPPH, destabilization of liposomes and release of calcein. The phenomena of Drug B release (right panel) is shown from one of the DC8,9PC clusters for clarity.
Abbreviations: DC8,9PC, 1,2 bis(tricosa-10,12-diynoyl)-sn-glycero-3-phosphocholine; DPPC, 1,2-dipalmitoyl-sn-glycero-3-phosphocholine; HPPH, 2-(1-Hexyloxyethyl)-2-devinyl pyropheophorbide-a.
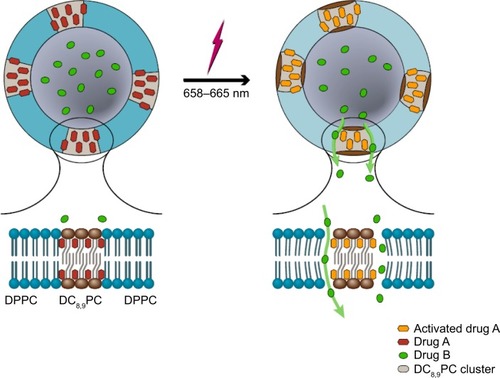
Table 1 Liposome formulations used in this study
Figure 2 Laser–induced phototriggering of liposomes and release of calcein.
Notes: (A) Spectral properties of various liposomes: Liposome formulations (I, II, and III) containing HPPH/calcein, calcein only, or HPPH only respectively were examined for their absorption characteristics by measurement of spectral properties. Broken lines, Formulation I; Solid lines, Formulation II; Dotted lines, Formulation III. (B) Effect of laser treatment on release of calcein from liposomes: Calcein loaded liposomes (Formulation I [with HPPH] or II [without HPPH]) were treated with the 660 nm laser for 5 minutes and release of calcein was monitored. Percent release of calcein was calculated taking total fluorescence as 100% in a given sample in the presence of TX100. The values for Formulation I were derived by taking the average of four independent experiments (±SD). The values for Formulation II are representative of at least three independent experiments (± SD). Diagonal bars, before laser treatment; solid bars, after 5 minutes laser treatment.
Abbreviations: HPPH, 2-[1-hexyloxyethyl]-2-devinyl pyropheophorbide-a; SD, standard deviation; min, minute.
![Figure 2 Laser–induced phototriggering of liposomes and release of calcein.Notes: (A) Spectral properties of various liposomes: Liposome formulations (I, II, and III) containing HPPH/calcein, calcein only, or HPPH only respectively were examined for their absorption characteristics by measurement of spectral properties. Broken lines, Formulation I; Solid lines, Formulation II; Dotted lines, Formulation III. (B) Effect of laser treatment on release of calcein from liposomes: Calcein loaded liposomes (Formulation I [with HPPH] or II [without HPPH]) were treated with the 660 nm laser for 5 minutes and release of calcein was monitored. Percent release of calcein was calculated taking total fluorescence as 100% in a given sample in the presence of TX100. The values for Formulation I were derived by taking the average of four independent experiments (±SD). The values for Formulation II are representative of at least three independent experiments (± SD). Diagonal bars, before laser treatment; solid bars, after 5 minutes laser treatment.Abbreviations: HPPH, 2-[1-hexyloxyethyl]-2-devinyl pyropheophorbide-a; SD, standard deviation; min, minute.](/cms/asset/4548e380-fe09-4ec9-b54a-a65a516a270d/dijn_a_72143_f0002_b.jpg)
Figure 3 Effect of laser treatment on the biophysical characteristics and integrity of liposomes.
Notes: (A) Formulation IV (calcein-HPPH) or V (calcein only) were treated with 660 nm laser for 5 minutes and were analyzed for changes in their UV-VIS spectral properties and hydrodynamic size analysis by DLS. Data for Formulation IV is shown in (A) (a) and (c). Data for Formulation V is shown in (A) (b) and (d). UV-VIS spectra are shown in left panels (A [a] and [b]) where absorbance is plotted against the wavelength (nm). Hydrodynamic size analysis is shown in right panels (A [c] and [d]). Average diameter (x-axis) is plotted against the peak intensity of liposomes (average of three runs from a single experiment). Dashed lines, control samples; solid lines, 5 minute laser-treated samples. The results are representative of at least three independent experiments. (B) Effect of laser treatment on fractionation pattern of liposomes on a size exclusion column: Formulation IV (calcein-HPPH liposomes) was either untreated or treated with the laser for 5 minutes and was fractionated on a Sepharose CL-6B column. 1 mL fractions were collected. 0.2 mL aliquots of the column fractions were analyzed for the HPPH by monitoring absorbance at 665 nm. The absorbance of HPPH in each fraction is plotted against the fraction numbers in (B). Dashed lines, untreated liposomes; solid lines, laser-treated liposomes. (C) Effect of laser treatment on morphology of liposomes: Formulation IV (calcein-HPPH liposomes) was treated with the laser for 5 minutes and the liposomes were imaged by electron. The images are shown in (C). Left panel, negative stained liposomes; top, untreated; bottom, laser treated, (bar 100 nm). Right panel, cryo-EM images liposomes; top, untreated; bottom, laser treated, (bar 200 nm). Arrows indicate deformability (crenations) in the liposomes upon laser treatment.
Abbreviations: DLS, dynamic light scattering; EM, electron microscopy; HPPH, 2-[1-hexyloxyethyl]-2-devinyl pyropheophorbide-a; UV-VIS, ultraviolet–visible spectroscopy; min, minute.
![Figure 3 Effect of laser treatment on the biophysical characteristics and integrity of liposomes.Notes: (A) Formulation IV (calcein-HPPH) or V (calcein only) were treated with 660 nm laser for 5 minutes and were analyzed for changes in their UV-VIS spectral properties and hydrodynamic size analysis by DLS. Data for Formulation IV is shown in (A) (a) and (c). Data for Formulation V is shown in (A) (b) and (d). UV-VIS spectra are shown in left panels (A [a] and [b]) where absorbance is plotted against the wavelength (nm). Hydrodynamic size analysis is shown in right panels (A [c] and [d]). Average diameter (x-axis) is plotted against the peak intensity of liposomes (average of three runs from a single experiment). Dashed lines, control samples; solid lines, 5 minute laser-treated samples. The results are representative of at least three independent experiments. (B) Effect of laser treatment on fractionation pattern of liposomes on a size exclusion column: Formulation IV (calcein-HPPH liposomes) was either untreated or treated with the laser for 5 minutes and was fractionated on a Sepharose CL-6B column. 1 mL fractions were collected. 0.2 mL aliquots of the column fractions were analyzed for the HPPH by monitoring absorbance at 665 nm. The absorbance of HPPH in each fraction is plotted against the fraction numbers in (B). Dashed lines, untreated liposomes; solid lines, laser-treated liposomes. (C) Effect of laser treatment on morphology of liposomes: Formulation IV (calcein-HPPH liposomes) was treated with the laser for 5 minutes and the liposomes were imaged by electron. The images are shown in (C). Left panel, negative stained liposomes; top, untreated; bottom, laser treated, (bar 100 nm). Right panel, cryo-EM images liposomes; top, untreated; bottom, laser treated, (bar 200 nm). Arrows indicate deformability (crenations) in the liposomes upon laser treatment.Abbreviations: DLS, dynamic light scattering; EM, electron microscopy; HPPH, 2-[1-hexyloxyethyl]-2-devinyl pyropheophorbide-a; UV-VIS, ultraviolet–visible spectroscopy; min, minute.](/cms/asset/d9088c04-d7e3-4288-94b5-00893c96a295/dijn_a_72143_f0003_b.jpg)
![Figure 3 Effect of laser treatment on the biophysical characteristics and integrity of liposomes.Notes: (A) Formulation IV (calcein-HPPH) or V (calcein only) were treated with 660 nm laser for 5 minutes and were analyzed for changes in their UV-VIS spectral properties and hydrodynamic size analysis by DLS. Data for Formulation IV is shown in (A) (a) and (c). Data for Formulation V is shown in (A) (b) and (d). UV-VIS spectra are shown in left panels (A [a] and [b]) where absorbance is plotted against the wavelength (nm). Hydrodynamic size analysis is shown in right panels (A [c] and [d]). Average diameter (x-axis) is plotted against the peak intensity of liposomes (average of three runs from a single experiment). Dashed lines, control samples; solid lines, 5 minute laser-treated samples. The results are representative of at least three independent experiments. (B) Effect of laser treatment on fractionation pattern of liposomes on a size exclusion column: Formulation IV (calcein-HPPH liposomes) was either untreated or treated with the laser for 5 minutes and was fractionated on a Sepharose CL-6B column. 1 mL fractions were collected. 0.2 mL aliquots of the column fractions were analyzed for the HPPH by monitoring absorbance at 665 nm. The absorbance of HPPH in each fraction is plotted against the fraction numbers in (B). Dashed lines, untreated liposomes; solid lines, laser-treated liposomes. (C) Effect of laser treatment on morphology of liposomes: Formulation IV (calcein-HPPH liposomes) was treated with the laser for 5 minutes and the liposomes were imaged by electron. The images are shown in (C). Left panel, negative stained liposomes; top, untreated; bottom, laser treated, (bar 100 nm). Right panel, cryo-EM images liposomes; top, untreated; bottom, laser treated, (bar 200 nm). Arrows indicate deformability (crenations) in the liposomes upon laser treatment.Abbreviations: DLS, dynamic light scattering; EM, electron microscopy; HPPH, 2-[1-hexyloxyethyl]-2-devinyl pyropheophorbide-a; UV-VIS, ultraviolet–visible spectroscopy; min, minute.](/cms/asset/b4436124-ff26-4382-801d-da29fb4d2153/dijn_a_72143_f0003a_c.jpg)
Figure 4 Mechanism(s) of laser-triggered release from liposomes.
Notes: (A and B) Effect of laser treatment on liposome-associated calcein and HPPH. (A) liposome-associated calcein, and (B) liposome associated HPPH. The liposomes (Formulations IV and V) were treated with the laser, and released calcein was removed by centrifugation of the samples. The concentrated liposomes were resuspended to their original volume and aliquoted into a 96 well-plate in triplicates (100 μL/well). The amounts of HPPH and calcein were determined by measurement of absorbance (665 nm HPPH, 490 nm calcein) and the lipid content in the samples was determined by measurement of Pi. Control samples (without laser treatment) were processed under identical conditions. Formulation IV, calcein-HPPH liposomes; Formulation V, calcein only liposomes. Untreated liposomes, gray bars; laser treated liposomes, dotted bars. The values are expressed as nmol of Calcein or HPPH/μmol lipid. Error bars represent ± SD for three individual measurements within single experiment. The results presented in the figure are representative of at least three independent experiments. (C) Determination of change in calcein quenching ratios upon laser treatment: liposomes were treated with the laser and the released calcein was separated from liposome-encapsulated calcein as described in legend to (A and B). The samples were then aliquoted in triplicates of 100 μL and the fluorescence of these samples was taken before and after the addition of 10 μL of 10% Triton X-100. TX-100 values were taken to be 100% calcein fluorescence. The data in (C) represents percent change in quenching ratios in the liposomes upon laser treatment. Error bars represent ± SD for three measurements within single experiment. The results presented in the figure are representative of at least three independent experiments. (D) Liposome disruption mechanisms: Two major liposome disruption mechanisms are shown in the cartoon (D). The total disruption of liposomes will not affect quenching ratios of the remaining intact liposomes whereas graded release will result in the change in quenching ratios.
Abbreviations: HPPH, 2-[1-hexyloxyethyl]-2-devinyl pyropheophorbide-a; SD, standard deviation.
![Figure 4 Mechanism(s) of laser-triggered release from liposomes.Notes: (A and B) Effect of laser treatment on liposome-associated calcein and HPPH. (A) liposome-associated calcein, and (B) liposome associated HPPH. The liposomes (Formulations IV and V) were treated with the laser, and released calcein was removed by centrifugation of the samples. The concentrated liposomes were resuspended to their original volume and aliquoted into a 96 well-plate in triplicates (100 μL/well). The amounts of HPPH and calcein were determined by measurement of absorbance (665 nm HPPH, 490 nm calcein) and the lipid content in the samples was determined by measurement of Pi. Control samples (without laser treatment) were processed under identical conditions. Formulation IV, calcein-HPPH liposomes; Formulation V, calcein only liposomes. Untreated liposomes, gray bars; laser treated liposomes, dotted bars. The values are expressed as nmol of Calcein or HPPH/μmol lipid. Error bars represent ± SD for three individual measurements within single experiment. The results presented in the figure are representative of at least three independent experiments. (C) Determination of change in calcein quenching ratios upon laser treatment: liposomes were treated with the laser and the released calcein was separated from liposome-encapsulated calcein as described in legend to (A and B). The samples were then aliquoted in triplicates of 100 μL and the fluorescence of these samples was taken before and after the addition of 10 μL of 10% Triton X-100. TX-100 values were taken to be 100% calcein fluorescence. The data in (C) represents percent change in quenching ratios in the liposomes upon laser treatment. Error bars represent ± SD for three measurements within single experiment. The results presented in the figure are representative of at least three independent experiments. (D) Liposome disruption mechanisms: Two major liposome disruption mechanisms are shown in the cartoon (D). The total disruption of liposomes will not affect quenching ratios of the remaining intact liposomes whereas graded release will result in the change in quenching ratios.Abbreviations: HPPH, 2-[1-hexyloxyethyl]-2-devinyl pyropheophorbide-a; SD, standard deviation.](/cms/asset/307b9cfb-1dce-48a6-bf12-d9150ccd1f8a/dijn_a_72143_f0004_c.jpg)
Figure 5 Effect of laser treatment of cell viability in the presence of liposomes.
Notes: (A) Loss of luciferase expression: MDA-MB-231LM2Luc+ cells plated on 96-well clusters (2×10⁴ cells per well) were incubated with 20 μL of Formulation IV (containing ~100 nmol lipid and 3 nmol HPPH)) or Formulation V (~100 nmol lipid and zero nmol HPPH). Subsequently, laser treatments were done and luciferase images were captured. Control wells, without addition of liposomes, were treated under identical conditions. Loss of luciferase expression was observed in the defined ROI within each image of cell well clusters upon laser treatment of the cells. (B) Cytotoxicity measurements: MDA-MB-231 cells incubated with Formulation I, II, or free HPPH were treated with the laser for 5 minutes, then placed on 96-well clusters in triplicate (2×10⁴ cells per well at 37°C). Incubations were continued for 48 hours and cell viability was monitored. (a) Cells incubated with Formulation I, (b) Cells incubated with Formulation II, and (c) Cells incubated with free HPPH. Values are presented using cells without laser treatment as 100% cell viability. ±SD, three samples from a single experiment. The results are reproducible from at least two independent experiments.
Abbreviations: HPPH, 2-[1-hexyloxyethyl]-2-devinyl pyropheophorbide-a; ROI, region of interest; SD, standard deviation.
![Figure 5 Effect of laser treatment of cell viability in the presence of liposomes.Notes: (A) Loss of luciferase expression: MDA-MB-231LM2Luc+ cells plated on 96-well clusters (2×10⁴ cells per well) were incubated with 20 μL of Formulation IV (containing ~100 nmol lipid and 3 nmol HPPH)) or Formulation V (~100 nmol lipid and zero nmol HPPH). Subsequently, laser treatments were done and luciferase images were captured. Control wells, without addition of liposomes, were treated under identical conditions. Loss of luciferase expression was observed in the defined ROI within each image of cell well clusters upon laser treatment of the cells. (B) Cytotoxicity measurements: MDA-MB-231 cells incubated with Formulation I, II, or free HPPH were treated with the laser for 5 minutes, then placed on 96-well clusters in triplicate (2×10⁴ cells per well at 37°C). Incubations were continued for 48 hours and cell viability was monitored. (a) Cells incubated with Formulation I, (b) Cells incubated with Formulation II, and (c) Cells incubated with free HPPH. Values are presented using cells without laser treatment as 100% cell viability. ±SD, three samples from a single experiment. The results are reproducible from at least two independent experiments.Abbreviations: HPPH, 2-[1-hexyloxyethyl]-2-devinyl pyropheophorbide-a; ROI, region of interest; SD, standard deviation.](/cms/asset/39b44477-e96a-4db6-800e-68a685a9be4d/dijn_a_72143_f0005_c.jpg)
Figure 6 In Vivo phototriggering of liposomes.
Notes: (A) Release of liposome-entrapped calcein upon phototriggering from liposomes in tumors of mice injected with liposomes. All images were normalized with the average prelaser treatment calcein fluorescence intensity in the tumor ROI. Top panel, Formulation IV, (a) Pre- and postlaser treatment images of calcein fluorescence intensity for the laser treated tumor, (b) Pre- and postlaser treatment images for the non-laser treated tumor in the same mouse as shown in panel (a); Bottom panel, Formulation V. (c) Pre- and postlaser treatment images of fluorescence intensity in laser treated tumor, (d) Pre- and postlaser treatment images for non-laser treated tumor in the same mouse as shown in panel (c). (B) Quantitation of differentially released calcein in the laser treated tumor area: differential change in the pre- and postlaser treatment calcein fluorescence intensity ratio between the laser treated and non-treated tumors for the Formulation IV and Formulation V injected mice. For each mouse, average fluorescence intensity in tumor ROI was calculated for both the laser treated and untreated tumor. Ir represents the ratio of fluorescence intensity of treated to the untreated tumor. Data is averaged over all the mice in the study. (n=5 for Formulation IV, and n=4 for Formulation V).
Abbreviations: ROI, region of interest; min, minutes.
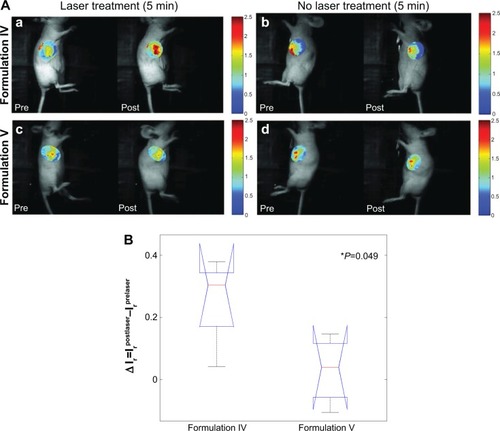
Figure 7 Effect of laser treatments on luciferase expression and tumor regression in mice injected with liposomes.
Notes: (A) Luciferase expression in mice injected with Formulation IV at various time periods. (B) Luciferase expression in mice injected with Formulation V at various time periods.
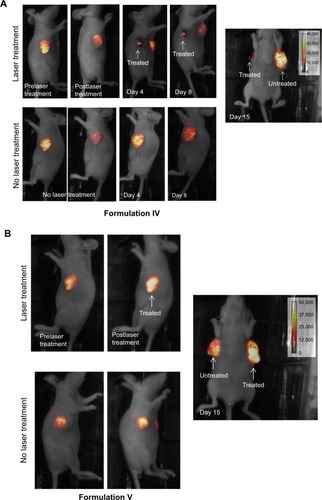
Figure 8 Tumor regression in liposomes injected mice upon laser treatment.
Notes: (A) Liposomes were injected in the mice and the animals were monitored for tumor regression up to 15 days. Tumor volumes were measured and data were averaged per group (n=4). D-6: six days prior to liposome injection and treatment; D0: liposome injection and treatment; D15: 15 days after liposome injection and treatment. (B) Histopathology analysis of tumors: xenografts were fixed in 10% neutral buffered formalin, routinely processed, paraffin-embedded, sectioned at 5 μm, and stained with hematoxylin and eosin (H&E). Stained sections were scanned into digital format via an AperoScanScope XT whole slide scanner at 40× magnification. Extractions to tiff format were done at various magnifications. A 0.1 mm scale bar is present within each image. All evaluations were performed by a board-certified veterinary pathologist.
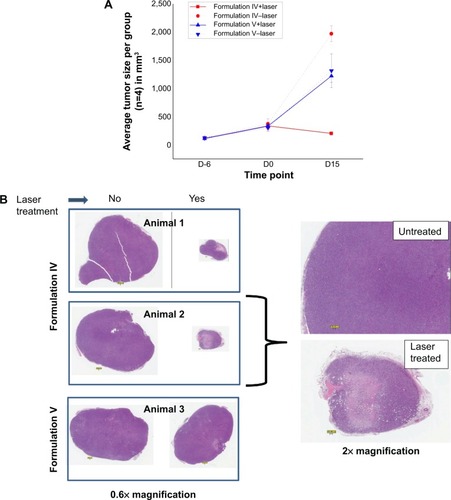
Figure S1 Quantitative determination of HPPH and calcein.
Notes: (A and B) Calcein and HPPH standard curves as indicated. (C) Effect of 660 nm laser treatment on photodamage of free HPPH. Various concentrations of free HPPH were treated with the laser for indicated times and HPPH concentration was determined. Percent HPPH remaining in the samples was calculated taking the corresponding concentrations of untreated HPPH as 100%.
Abbreviation: HPPH, 2-[1-hexyloxyethyl]-2-devinyl pyropheophorbide-a.
![Figure S1 Quantitative determination of HPPH and calcein.Notes: (A and B) Calcein and HPPH standard curves as indicated. (C) Effect of 660 nm laser treatment on photodamage of free HPPH. Various concentrations of free HPPH were treated with the laser for indicated times and HPPH concentration was determined. Percent HPPH remaining in the samples was calculated taking the corresponding concentrations of untreated HPPH as 100%.Abbreviation: HPPH, 2-[1-hexyloxyethyl]-2-devinyl pyropheophorbide-a.](/cms/asset/94e79b7e-0a7f-4288-bfd4-9924cf1e3ed2/dijn_a_72143_sf0001_b.jpg)
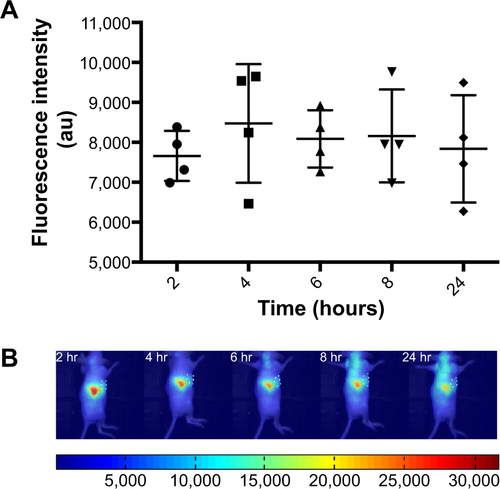
Figure S2 Biodistribution of liposomes in tumor-bearing mice.
Notes: For imaging studies the near IR lipid probe DiR, was included in the lipid mixtures. Liposome accumulation was monitored by measurement of DiR. Time-dependent accumulation of liposomes in tumors. (A) DiR fluorescence intensity in tumor ROI with time. (B) Representative images of DiR fluorescence, tumor ROI are outlined.
Abbreviations: IR, infrared; DiR, 1,1′-dioctadecyl-3,3,3′,3′-tetramethylindotricarbocyanine iodide (DiIC18(7)); ROI, region of interest; hr, hours.