Figures & data
Figure 1 Macroscopic aspect of thick poly(ε-caprolactone) electrospun nanofibrous membrane.
Notes: 700 μm thickness (A) and 1 cm thickness (B).
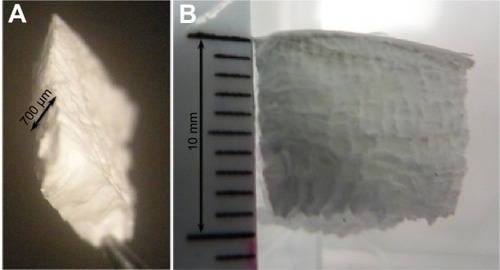
Figure 2 Scanning electron microscopy images of PCL electrospun nanofibrous 3D scaffolds.
Notes: 500 μm (A and B), 20 μm (C and D), and 500 nm (E and F) NF and NR4 scaffolds (A, C, and E and B, D, and F, respectively).
Abbreviations: NF, not functionalized; NR4, functionalized with (chitosan/BMP-7)4 nanocontainers; PCL, poly(ε-caprolactone).
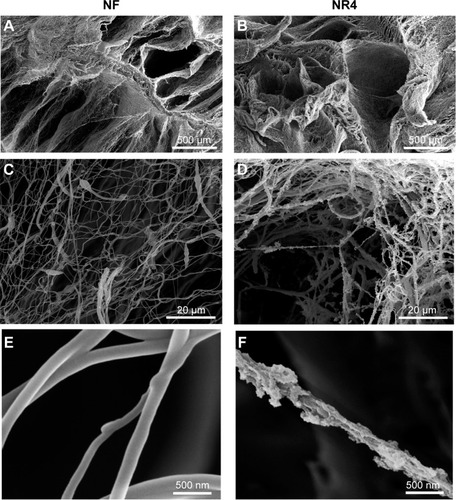
Figure 3 Biocompatibility analysis of the PCL electrospun nanofibrous 3D scaffold in the presence of HOBs.
Notes: (A) % AlamarBlue® reduction showing the metabolic activity of the cells at 3, 7, and 14 days of culture on the 3D scaffolds. n=9, P>0.05 each time. Bars = standard deviation. (B) Scanning electron microscopy images of PCL nanofibrous scaffolds (NF and NR4) seeded with human primary osteoblasts after 3, 7, and 14 days. For all images, scale bars =500 μm.
Abbreviations: D, day; HOBs, human primary osteoblasts; NF, not functionalized; NR4, functionalized with (chitosan/BMP-7)4 nanocontainers; PCL, poly(ε-caprolactone).
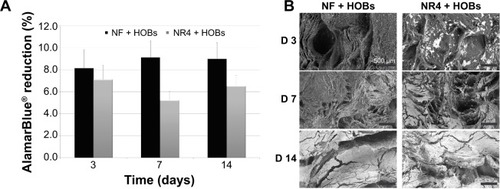
Figure 4 In vitro effect of BMP-7 nanoreservoirs on osteogenic differentiation of human osteoblasts.
Notes: In vitro expression of OCN, BSPII, and OPN in HOBs after 21 days of cell culture onto the PCL bare scaffolds (NF) or those equipped with BMP-7 nanocontainers (NR4). The nucleus was stained with DAPI (in blue), actin labelled with phalloidin (in red), and OCN, BSPII, and OPN were stained in green. For all images, scale bars =100 μm.
Abbreviations: BSPII, bone sialoprotein II; HOBs, human primary osteoblasts; NF, not functionalized; NR4, functionalized with (chitosan/BMP-7)4 nanocontainers; OCN, osteocalcin; OPN, osteopontin; PCL, poly(ε-caprolactone).
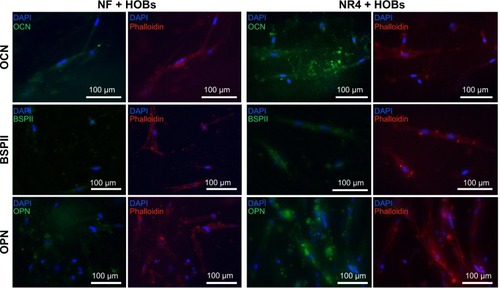
Figure 5 Histological analysis of the effect of BMP-7 nanoreservoirs in vivo on bone tissue regeneration.
Notes: Histological analysis of in vivo bone induction onto functionalized PCL scaffold (NR4) compared to bare PCL (NF) scaffold after 30 days of calvaria implantation in mice. Mallory coloration was used in order to identify mineralized extracellular matrix (pink) and cell nuclei (blue). The square area in the drawn scheme represents the histological section inside the mouse calvaria defects.
Abbreviations: HB, host bone; NF, not functionalized; NR4, functionalized with (chitosan/BMP-7)4 nanocontainers; PCL, poly(ε-caprolactone).
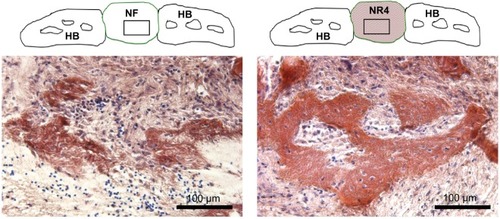
Figure 6 BMP-7 nanoreservoirs’ effect in vivo on bone mineralization.
Notes: (A) SEM micrographs, after 30 days of implantation in mouse skull, showing the morphology and composition of the scaffolds; corresponding elemental mapping of P (green), Ca (red), and C (blue) is depicted. Overall SEM visualization of the grafts is in gray. (B) In vivo bone induction onto NF scaffold or onto NR4 PCL scaffold 30 days after calvaria implantations in nude mice. Cell nucleus is in blue, stained with DAPI; bone information is shown in green, stained with calcein. For all images, scale bars =100 μm.
Abbreviations: C, carbon; Ca, calcium; HB, host bone; NF, not functionalized; NR4, functionalized with (chitosan/BMP-7)4 nanocontainers; P, phosphorus; PCL, poly(ε-caprolactone); SEM, scanning electron microscopy.
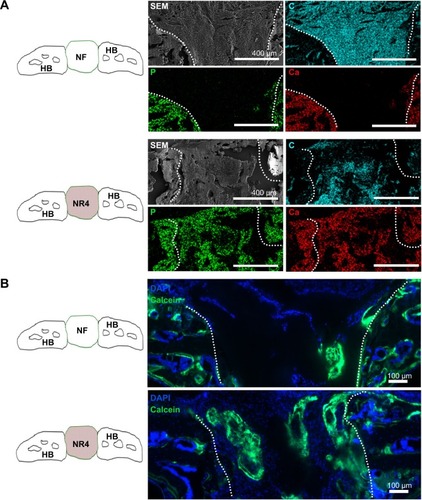
Figure 7 Nanoindentation analysis of the BMP-7 nanoreservoirs’ effect on the implants.
Notes: Elastic modulus as a function of penetration depth of nanoindentations carried out on NR4 and NF implants after 30 days’ implantation in mouse calvariae. The crosses illustrate the confidence interval with 95% of certainty.
Abbreviations: NF, not functionalized; NR4, functionalized with (chitosan/BMP-7)4 nanocontainers.
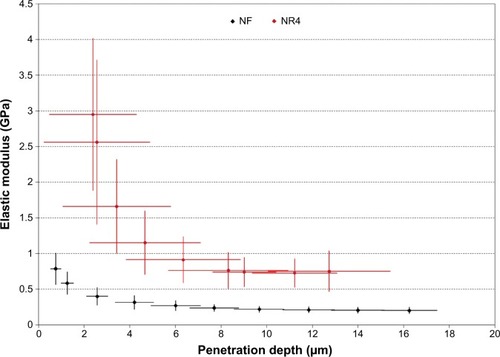
Figure 8 In vivo analysis of combined BMP-7 and hMSCs on bone tissue calcification.
Notes: SEM micrographs showing the morphology and elemental composition of the NF and NR4 scaffolds seeded with hMSCs after 30 days of implantation in mouse skull. Elemental mapping of P (green), Ca (red) and C (blue) is depicted. Overall SEM visualization of the grafts is in gray. For all images, scale bars =400 μm.
Abbreviations: C, carbon; Ca, calcium; HB, host bone; hMSCs, human mesenchymal stem cells; NF, not functionalized; NR4, functionalized with (chitosan/BMP-7)4 nanocontainers; P, phosphorus; SEM, scanning electron microscopy.
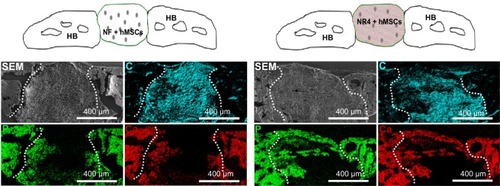
Figure 9 In vivo analysis of BMP-7 nanoreservoirs’ and hMSCs’ effect on bone tissue mineralization.
Notes: In vivo bone induction onto NF PCL scaffold with hMSCs (A) or onto NR4 PCL scaffold with hMSCs (B) 30 days after calvaria implantation in nude mice. Cell nucleus is in blue, stained with DAPI; bone information is shown in green, stained with calcein. For all images, scale bars =100 μm.
Abbreviations: HB, host bone; hMSCs, human mesenchymal stem cells; NF, not functionalized; NR4, functionalized with (chitosan/BMP-7)4 nanocontainers; PCL, poly(ε-caprolactone).
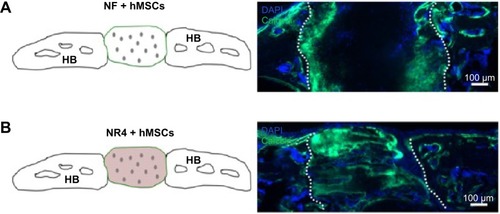
Figure S1 In vitro metabolic activity of MSCs on the nanofunctionalized PCL scaffold.
Notes: % AlamarBlue® reduction on the thick nanofiber implant without BMP-7 (NF) or NR4 implant at 3 days, 7 days, and 14 days. n=9, P>0.05 each time. Scale bars = standard deviation.
Abbreviations: MSCs, mesenchymal stem cells; NF, not functionalized; NR4, functionalized with (chitosan/BMP-7)4 nanocontainers; PCL, poly(ε-caprolactone).
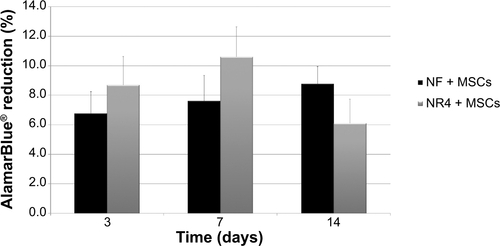
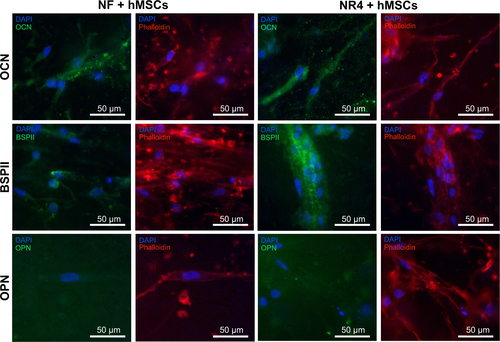
Figure S2 In vitro expression of OCN, OPN, and BSPII in hMSCs after 21 days of cell culture on bare PCL 3D scaffolds (NF) or those equipped with BMP-7 nanocontainers (NR4).
Notes: Nucleus was stained with DAPI (in blue), actin-phalloidin (in red), and OCN, OPN, and BSPII were stained in green. For all images, scale bars =50 μm.
Abbreviations: BSPII, bone sialoprotein II; hMSCs, human mesenchymal stem cells; NF, not functionalized; NR4, functionalized with (chitosan/BMP-7)4 nanocontainers; OCN, osteocalcin; OPN, osteopontin; PCL, poly(ε-caprolactone).