Figures & data
Figure 1 Thermal analysis of TiO2 NP samples A.5, A.10, and A.40.
Notes: (A) TGA; and (B) TPD–MS.
Abbreviations: NP, nanoparticle; TGA, thermogravimetric analysis; TPD–MS, temperature programmed desorption–mass spectrometry; T, temperature.
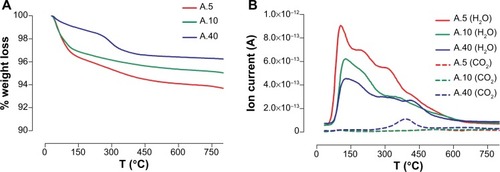
Figure 2 XPS of TiO2 NP samples A.5, A.10, and A.40.
Notes: (A) Survey scan; (B) atomic percent of surface elements; (C) high resolution scan of O 1s.
Abbreviations: NP, nanoparticle; XPS, X-ray photoelectron spectroscopy; At%, atomic percent; pos, position.
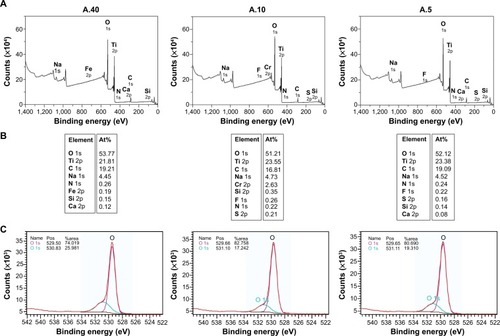
Table 1 Agglomerate sizes expressed as hydrodynamic diameter of TiO2 NPs (100 mg/L) in RPMI 1640 cell culture medium with (100 mg/L) and without proteins, after 24 h and 3 h (in brackets) rotation at 37°C
Table 2 Zeta potentials of TiO2 NPs in RPMI medium with and without proteins, after 24 h rotation at 37°C
Figure 3 Quantity adsorbed of proteins onto TiO2 NPs after 2-h and 24-h rotations at 37°C. The results for samples A.5, A.10, and A.40 are expressed as medians with interquartile range.
Abbreviations: HSA, human serum albumin; Glbs, γ-globulins; Fib, fibrinogen; h, hours; quant, quantity; ads, adsorbed; NPs, nanoparticles.
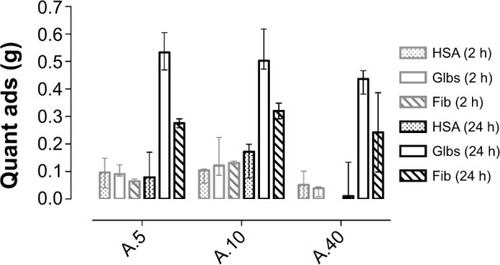
Figure 4 Degree of cellular uptake, showing the concentration (in μg/L) of titanium element associated with L929 fibroblasts, after 24 h exposure to TiO2 NPs suspended in different media. The results are expressed as medians with interquartile range.
Note: *Statistical significance (P<0.05, Dunn’s multiple comparison test).
Abbreviations: HSA, human serum albumin; Glbs, γ-globulins; Fib, fibrinogen; h, hours; NPs, nanoparticles.
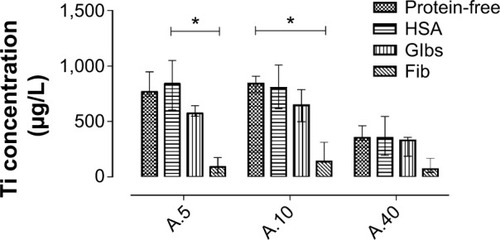
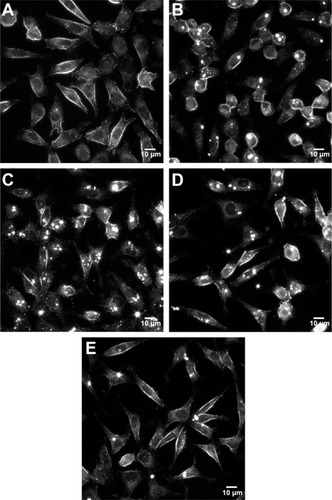
Figure 5 URI images of L929 fibroblasts at 1000× magnification (scale bar: 10 μm), after 24 h exposure to 0.5 mg/L of TiO2 NPs (sample A.5) in different media.
Notes: (A) Control cells not exposed to NPs. (B) Protein-free. (C) HSA. (D) Glb. (E) Fib. Bright spots are NPs/agglomerates either internalized or attached to the cell membrane.
Abbreviations: URI, ultra-high resolution imaging; h, hours; NPs, nanoparticles; HSA, human serum albumin; Glbs, γ-globulins; Fib, fibrinogen.