Figures & data
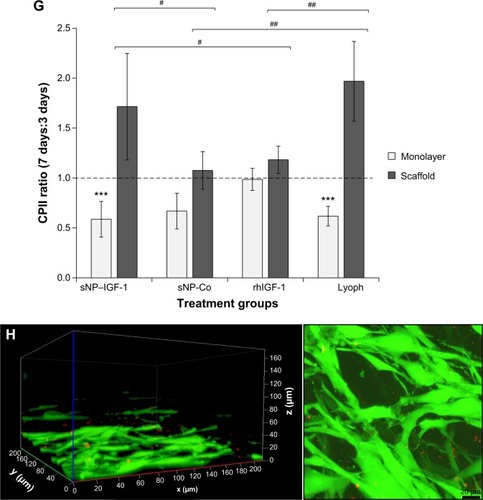
Figure 1 Chemical synthesis of IGF-1 nanoparticles and application for in vitro cultivation of dedifferentiated chondrocytes.
Notes: (A) Conjugation of the thiolated IGF-1 to PEG24-maleimide functionalized red fluorescent silica nanoparticles (sicastar®-redF). (B) In passage three, chondrocytes were seeded either on plastic (2-D; upper panel) or on a collagen scaffold (3-D; lower panel) with a concentration of 1×10⁵ cells per 1 cm2. Cells were incubated with (a) platelet growth factor lyophilisate (771 pg/μL IGF-1, 517 pg/mL TGF-β1, 2.46 pg/mL VEGF, 2.20 pg/mL basic FGF); (b) 50 ng/mL rhIGF-1; (c) red-fluorescent rhIGF-1-coupled silica nanoparticles (12.5 μg/mL particle suspension =50 ng/mL rhIGF-1); or (d) red-fluorescent control silica nanoparticles (12.5 μg/mL particle suspension =50 ng/mL NH2) for 48 and 96 hours, as well as for 3, 7, and 14 days. The supplements (lyophilisate, rhIGF-1, nanoparticles) were only added in the beginning, when the cells were seeded. During cultivation over 14 days, medium (without supplements) was changed every 2–3 days.
Abbreviations: IGF-1, insulin-like growth factor 1; TGF-β1, transforming growth factor beta 1; VEGF, vascular endothelial growth factor; FGF, fibroblast growth factor; rhIGF-1, recombinant human IGF-1.
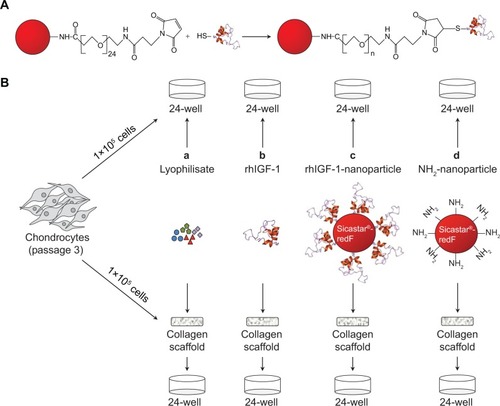
Figure 2 In vitro characterization of chondrocytes growth on the collagen-based scaffold.
Notes: (A) Representative SEM pictures of the scaffold: untreated and dried (upper left); incubated in DMEM supplemented with 10% FCS, 1% penicillin/streptomycin, and 1% amphotericin B for 7 days (upper right); and incubated with chondrocytes for 7 days (lower picture). (B) Fluorescence microscopy of live/dead stained chondrocytes grown on the collagen scaffold for 3, 7, and 14 days (vital cells = green; dead cells = red). (C) Confocal microscopy (z-stack) of 7-day-old chondrocytes infiltrating the scaffold up to 120 μm.
Abbreviations: DMEM, Dulbecco’s Modified Eagle’s Medium; FCS, fetal calf serum; SEM, scanning electron microscopy.
Figure 3 Metabolic cell activity and matrix production of primary chondrocytes cultured on the collagen-based scaffold.
Notes: Chondrocytes were isolated from the hyaline cartilage of patients (n≥5) undergoing primary total knee joint replacement and seeded (1×10⁵ cells/cm2) onto the scaffold before being incubated for 3, 7, and 14 days. The metabolic activity was measured via WST-1 (left panel). The production of CPII was quantified and normalized to the DNA content per patch (right panel). Each symbol (circle, triangle) represents a donor. Black lines correspond to the median. Analysis of variance post hoc-LSD was conducted (no significant differences between 3, 7, and 14 days of cultivation).
Abbreviations: CPII, procollagen type II; LSD, least significant difference; OD, optical density; WST-1, water-soluble-tetrazolium salt.
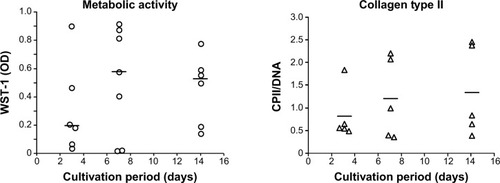
Figure 4 Binding of IGF-1-coupled nanoparticles by chondrocytes grown in a monolayer for 2 and 4 days.
Notes: Chondrocytes were isolated from the hyaline cartilage of patients (n=3) undergoing primary total knee joint replacement and cultured in a monolayer (1×10⁵ cells per well in a 24-well plate). Cells were suspended with medium supplemented with red-fluorescent rhIGF-1-coupled nanoparticles (12.5 μg/mL particle suspension =50 ng/mL rhIGF-1). During cultivation, no medium change was conducted. After 2 and 4 days, cells were stained with calcein-AM to visualize vital cells (green, upper left and lower left) using a fluorescence microscope. The wavelength of 569–585 nm was used to visualize IGF-1-coupled nanoparticles (red, upper middle and lower middle). The pictures of cells and particles were combined (green, upper right and lower right; overlays). Red darts indicate particles bound by chondrocytes. White bar =100 μm.
Abbreviation: calcein-AM, calcein-acetoxymethyl; IGF-1, insulin-like growth factor 1; rhIGF-1, recombinant human IGF-1.
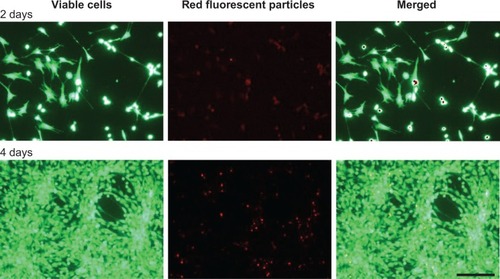
Figure 5 Effect of IGF-1-coupled nanoparticles on chondrocytes grown in a monolayer for 2 and 4 days.
Notes: Chondrocytes were isolated from the hyaline cartilage of patients (n=3) undergoing primary total knee joint replacement and were cultured in a monolayer (1×10⁵ cells per well in a 24-well plate). Cells were suspended in serum-free medium supplemented with rhIGF-1-coupled nanoparticles (sNP–IGF-1; 12.5 μg/mL particle suspension =50 ng/mL rhIGF-1), control particles (sNP-Co; 12.5 μg/mL particle suspension =50 ng/mL NH2), and rhIGF-1 (50 ng/mL). No medium change was conducted. After 2 and 4 days, CICP (osteogenic marker) as well as CPII (chondrogenic marker) were quantified in the cell supernatant by means of enzyme-linked immunosorbent assay. Data were normalized by division with WST-1 absorption values. Boxes denote interquartile ranges, horizontal lines within the boxes denote medians, and whiskers denote minimum and maximum values. Analysis of variance post hoc-LSD was conducted (there were no significant differences between 2 and 4 days of incubation nor between the 3 different treatments).
Abbreviations: CICP, procollagen type I; CPII, procollagen type II; LSD, least significant difference; sNP, silica nanoparticles; sNP-Co, control nanoparticles; WST-1, water-soluble-tetrazolium salt; IGF-1, insulin-like growth factor 1; rhIGF-1, recombinant human IGF-1.
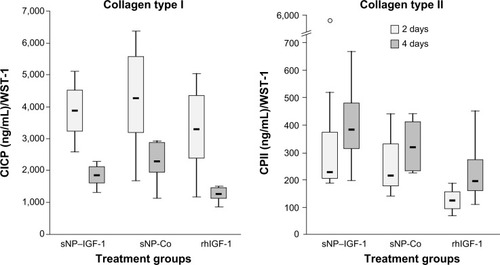
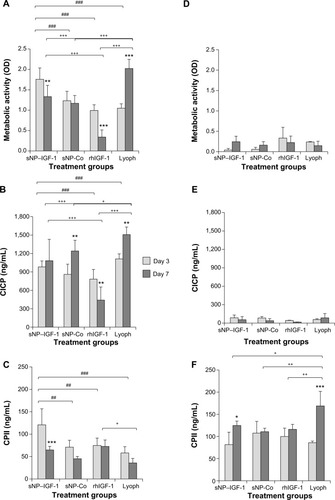
Figure 6 Collagen scaffolds enriched with IGF-1-coupled nanoparticles and growth factor lyophilisate have a positive impact on early chondrogenic redifferentiation.
Notes: Chondrocytes were isolated from hyaline cartilage of patients (n≥3) undergoing primary total knee joint replacement and were either cultured on cell culture plastic (A–C) or on a collagen scaffold (D–F) at a concentration of 1×10⁵ cells/1 cm2 each. Initially, culture medium was supplemented with rhIGF-1-coupled nanoparticles (sNP– IGF-1; 12.5 μg/mL particle suspension =50 ng/mL rhIGF-1), control particles (sNP-Co; 12.5 μg/mL particle suspension =50 ng/mL NH2), rhIGF-1 (50 ng/mL), and growth factor Lyoph. Medium change (without supplements) was conducted every 2–3 days. After 3 and 7 days of cultivation, metabolic cell activity was determined with WST-1 assay, and CICP (osteogenic marker) as well as CPII (chondrogenic marker) were quantified in the cell supernatant by means of enzyme-linked immunosorbent assay. Means and standard deviations are demonstrated. For statistically significance analyses, the post hoc-LSD ANOVA was applied (7 days compared to 3 days: *P<0.05, **P<0.01, ***P<0.001; groups compared at 3 days: ##P<0.01, ###P<0.001; groups compared at 7 days: +P<0.05, ++P<0.01, +++P<0.001). (G) Calculation of the ratio (7 days:3 days) of procollagen type II production by cells grown on scaffolds or on plastic with sNP–IGF-1, sNP-Co, rhIGF-1, and Lyoph. The post hoc-LSD ANOVA was applied (comparison of groups: #P<0.05, ##P<0.01; scaffold compared to monolayer: ***P<0.001). (H) Cells grown on the collagen scaffold enriched with sNP–IGF-1 were stained with calcein-AM after 7 days (viable cells: fluoresce green; nanoparticles fluoresce: red). The left diagram shows a z-stack and the right picture shows a representative microscopic top view.
Abbreviations: ANOVA, analysis of variance; calcein-AM, calcein-acetoxymethyl; CICP, procollagen type I; CPII, procollagen type II; Lyoph, lyophilisate; LSD, least significant difference; OD, optical density; sNP, silica nanoparticles; sNP-Co, control nanoparticles; WST-1, water-soluble-tetrazolium salt; IGF-1, insulin-like growth factor 1; rhIGF-1, recombinant human IGF-1.