
Figures & data
Figure 1 Synthesis and characterization of PBSNPs.
Notes: (A) UV–visible absorption spectra of PBSNPs prepared using different concentrations of polymyxin B. (B) Size and morphology analysis of PBSNPs by TEM, (C) FTIR spectra summarizing the presence of functional groups on (a) pure polymyxin B, (b) PBSNPs, (D) CD spectra for polymyxin B, PBSNPs, and CSNPs.
Abbreviations: PBSNPs, polymyxin B-capped silver nanoparticles; TEM, transmission electron microscopy; FTIR, Fourier transform infrared; CD, circular dichroism; CSNPs, citrate-capped silver nanoparticles.
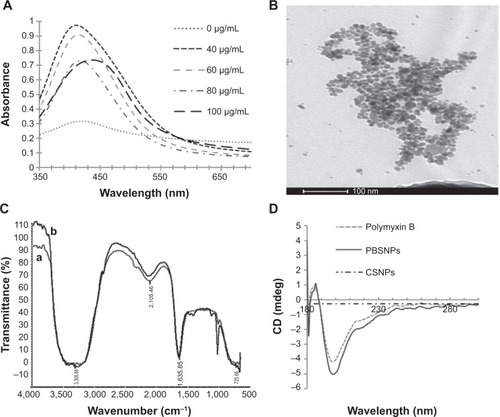
Table 1 MIC of polymyxin B, CSNPs, and PBSNPs
Figure 2 Scanning electron micrograph.
Notes: (A) and (D) show control cells (without SNPs). (B) and (E) show CSNPs-treated cells. (C) and (F) PBSNPs-treated cells. (A–C) Vibrio fluvialis L-15318 and (D–F) Pseudomonas aeruginosa PAO1.
Abbreviations: SNPs, silver nanoparticles; CSNPs, citrate-capped silver nanoparticles; PBSNPs, polymyxin B-capped silver nanoparticles.
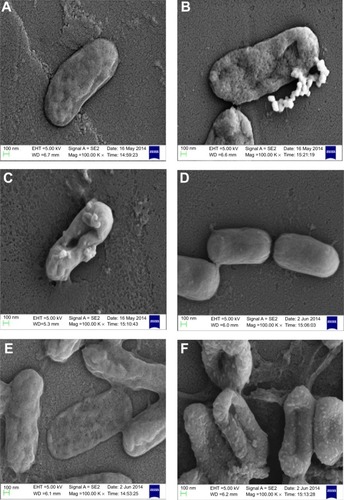
Figure 3 Inhibition of biofilm formation of Pseudomonas aeruginosa PAO1 cells.
Notes: (A) P. aeruginosa PAO1 cells treated with PBSNPs, (B) P. aeruginosa PAO1 cells treated with CSNPs. The line graph indicates the biofilm biomass at 550 nm (OD550), and the bar graph represents the bacterial growth at 600 nm (OD600).
Abbreviations: CSNPs, citrate-capped silver nanoparticles; OD, optical density; PBSNPs, polymyxin B-capped silver nanoparticles.
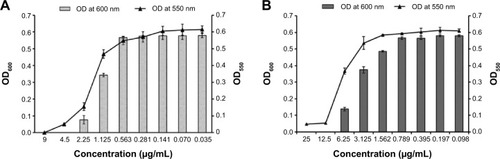
Figure 4 Live/Dead staining of biofilm on glass coverslip.
Notes: (A) PBSNPs MIC-treated Pseudomonas aeruginosa PAO1 cells, (B) PBSNPs sub-MIC-treated P. aeruginosa PAO1 cells, and (C) untreated P. aeruginosa PAO1 cells. A–C: (i) represents green cells as live, and (ii) red cells as dead.
Abbreviations: PBSNPs, polymyxin B-capped silver nanoparticles; MIC, minimum inhibitory concentration.
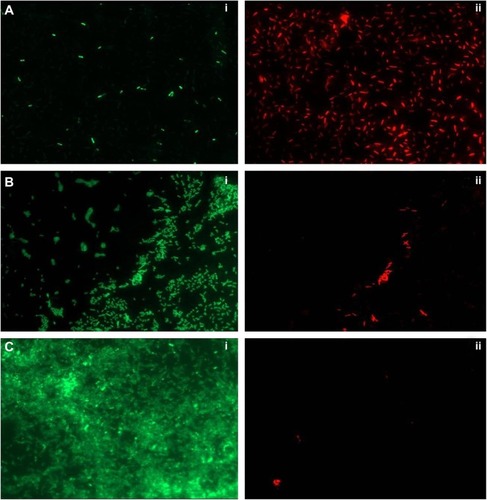
Figure 5 Live/Dead staining of planktonic Pseudomonas aeruginosa PAO1 cells by flow cytometer and FM.
Notes: Flow cytometer scatter plot for (A) untreated and unstained P. aeruginosa cells, (B) untreated SYTO9/PI stained, and (C) PBSNPs MIC-treated P. aeruginosa PAO1 cells stained with SYTO9/PI stains was analyzed; LL shows the unstained cells, UL region represents live cells, and dead cells are seen in the UR region. FM of cells prepared (D) untreated stained cells and (E) PBSNPs MIC-treated stained cells (i) represents live cells stained as green, (ii) dead cells stained as red.
Abbreviations: FITC, fluorescein isothiocyanate; PE, phycoerythrin; FM, fluorescence microscopy; PBSNPs, polymyxin B-capped silver nanoparticles; MIC, minimum inhibitory concentration; LL, lower left; LR, lower right; PI, propidium iodide; UL, upper left; UR, upper right.
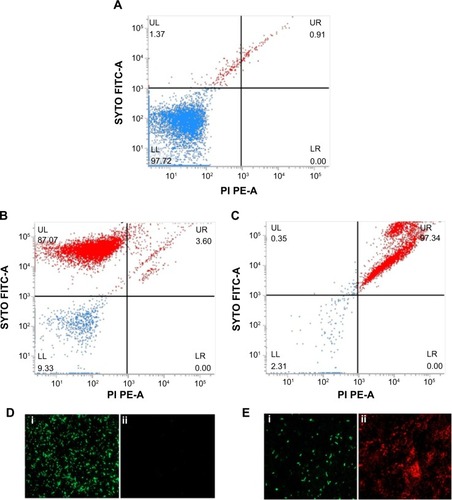
Figure 6 Characterization of coating and antibacterial activity of CSNPs and PBSNPs against Pseudomonas aeruginosa PAOI.
Notes: (A) AFM image of PBSNPs coated on surgical blade, (B) antimicrobial assay displaying the antimicrobial activity of (a) blade coated with PBSNPs, (b) blade coated with CSNPs, (c) blade coated with PBSNPs followed by proteinase K treatment, and (d) uncoated blade against Pseudomonas aeruginosa PAO1. Zone of inhibition is observed surrounding the blade.
Abbreviations: AFM, atomic force microscopy; PBSNPs, polymyxin B-capped silver nanoparticles; CSNPs, citrate-capped silver nanoparticles.
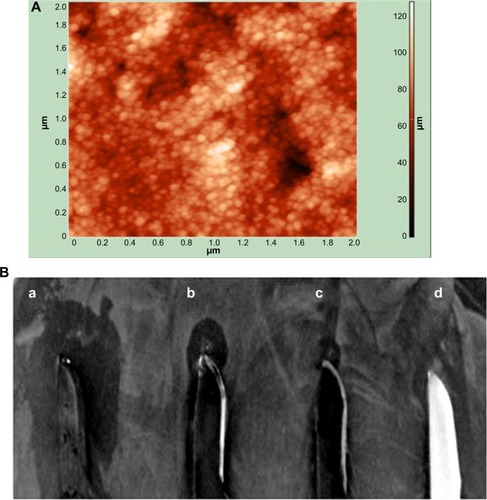
Figure 7 Endotoxin removal capability of PBSNPs.
Notes: (A) Control endotoxin (no agent added); removal by (B) PBSNPs, (C) CSNPs. Original picture of the wells (top inset) along with graphical representation (bottom). Percentage on X-axis represents the residual endotoxin after the treatment.
Abbreviations: OD, optical density; PBSNPs, polymyxin B-capped silver nano-particles; CSNPs, citrate-capped silver nanoparticles.
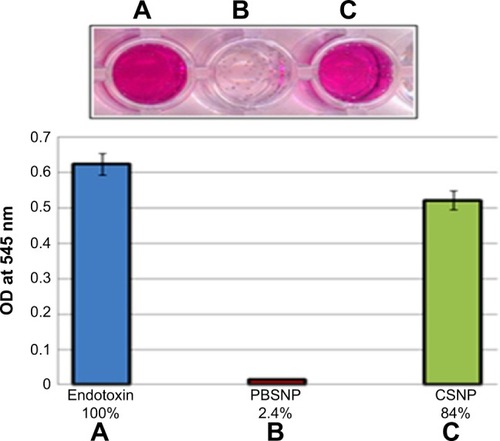
Figure S1 Transmission electron micrograph showing citrate-capped silver nanoparticles (CSNPs).
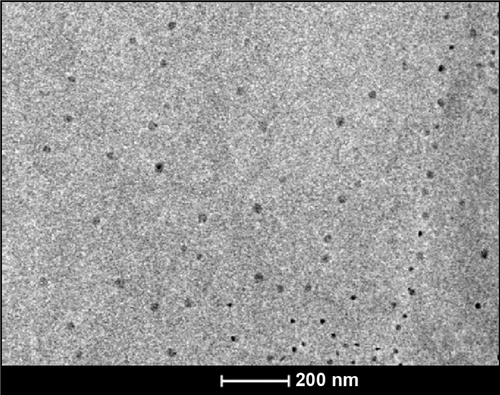
Figure S2 Scanning electron micrograph of PBSNPs-treated Vibrio fluvialis L-15318 at different magnifications (A) 20,000× and (B) 50,000×.
Abbreviation: PBSNPs, polymyxin B-capped silver nanoparticles.
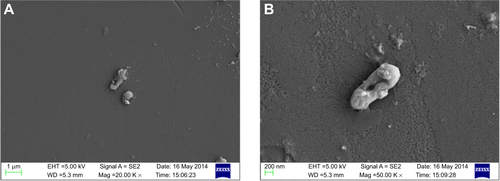
Figure S3 Scanning electron micrograph of CSNPs-treated Vibrio fluvialis L-15318 at different magnifications (A) 5,000×, (B) 20,000×, and (C) 50,000×.
Abbreviation: CSNPs, citrate-capped silver nanoparticles.
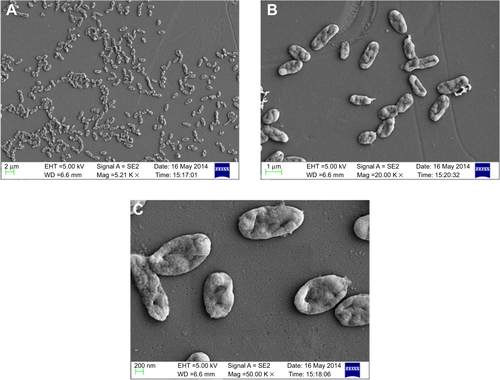
Figure S4 Scanning electron micrograph of untreated Vibrio fluvialis L-15318 at different magnifications (A) 5,000×, (B) 10,000×, and (C) 50,000×.
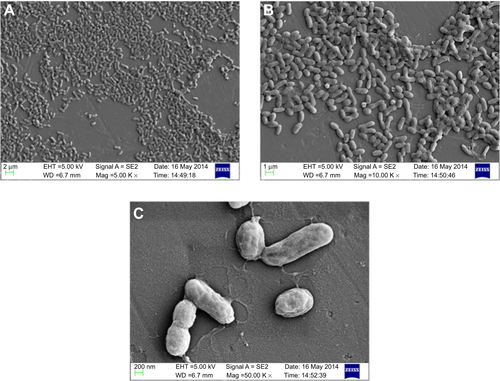
Figure S5 Scanning electron micrograph of PBSNPs-treated Pseudomonas aeruginosa PAO1 at different magnifications (A) 5,000×, (B) 10,000×, and (C) 50,000×.
Abbreviation: PBSNPs, polymyxin B-capped silver nanoparticles.
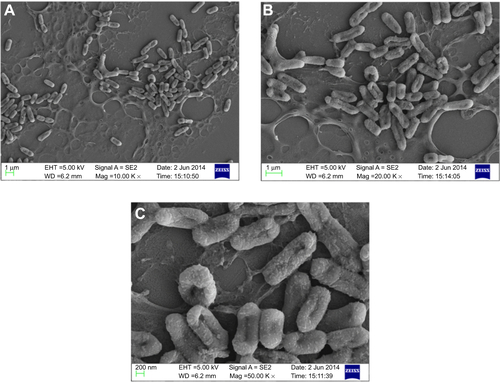
Figure S6 Scanning electron micrograph of CSNPs-treated Pseudomonas aeruginosa PAO1 at different magnifications (A) 5,000×, (B) 10,000×, and (C) 50,000×.
Abbreviation: CSNPs, citrate-capped silver nanoparticles.
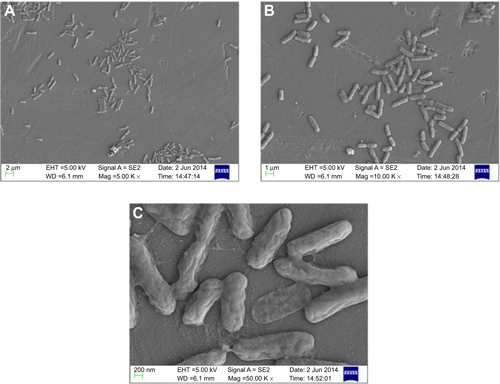
Figure S7 Scanning electron micrograph of untreated Pseudomonas aeruginosa PAO1 at different magnifications (A) 5,000×, (B) 10,000×, and (C) 50,000×.
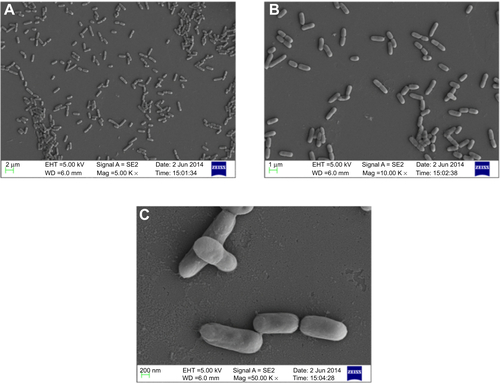
Table S1 Synergy or additive effect between CSNPs and polymyxin B as presented in FIC index